Examples Gallery#
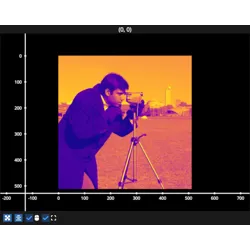
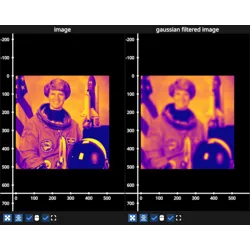
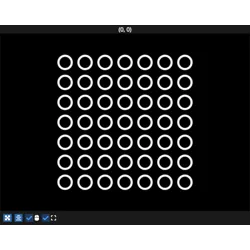
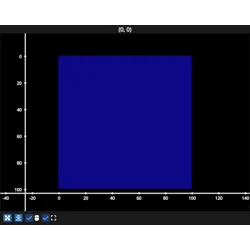
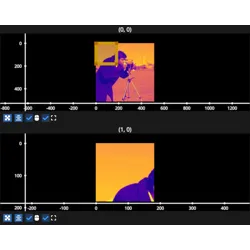
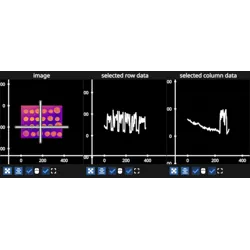
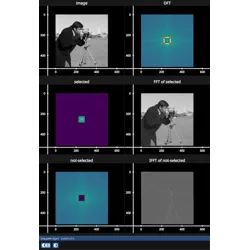
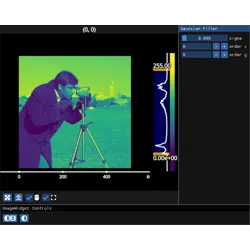
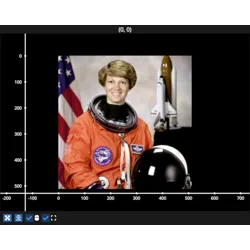
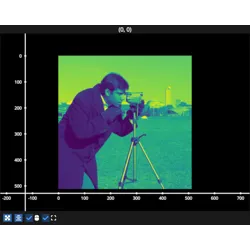
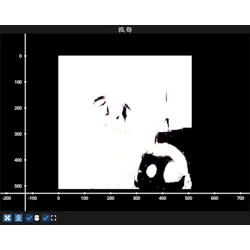
Image Examples#


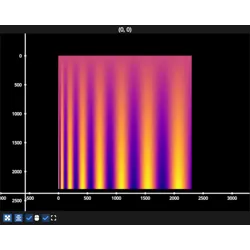
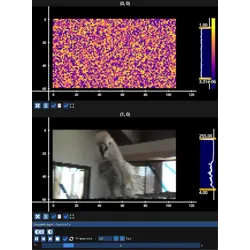
Heatmap Examples#
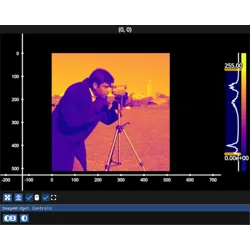
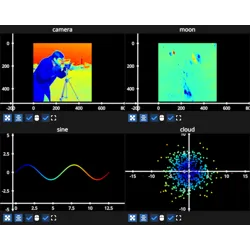
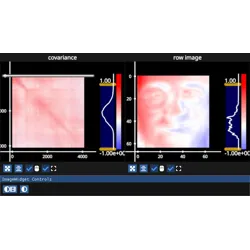
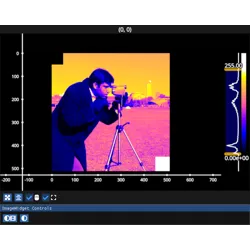
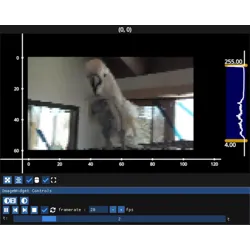
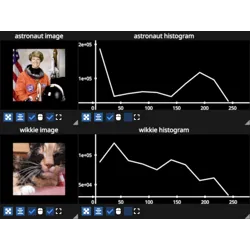
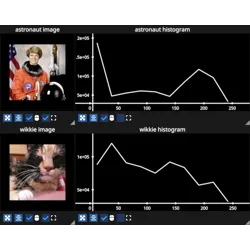
ImageWidget Examples#

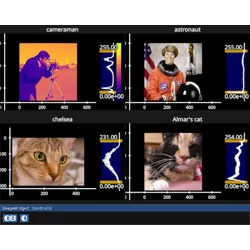
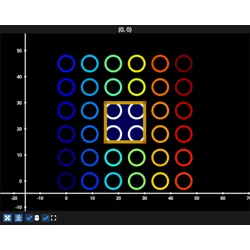
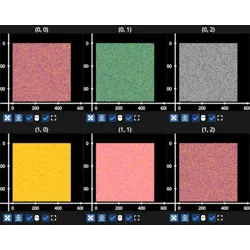
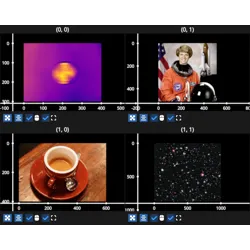
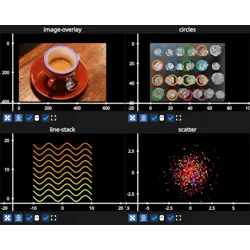
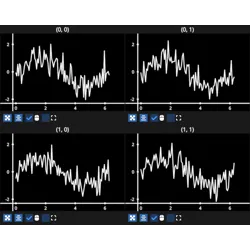
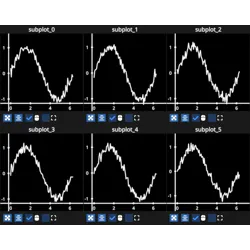
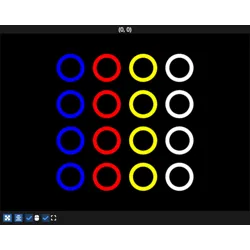
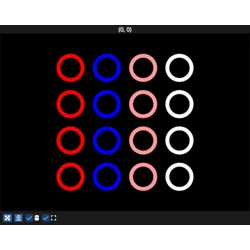
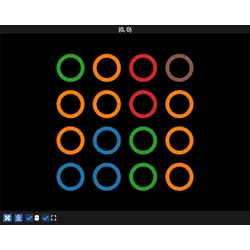
GridPlot Examples#
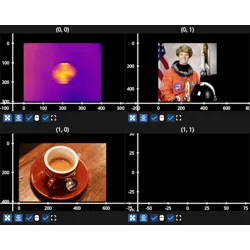

Window Layout Examples#


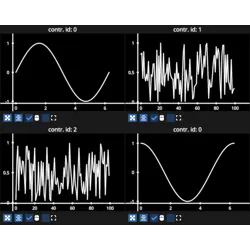
Controller examples#
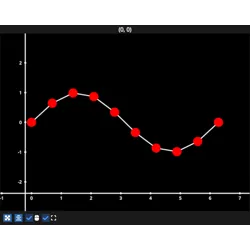
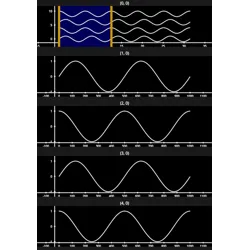
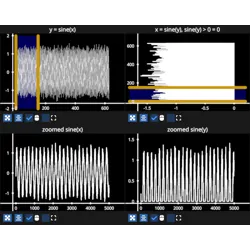
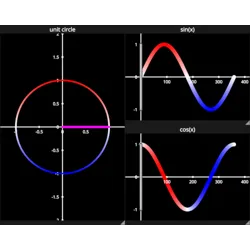
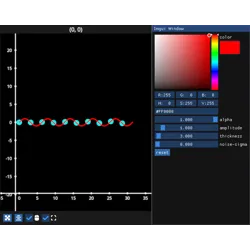
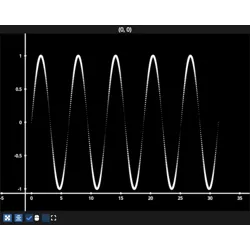
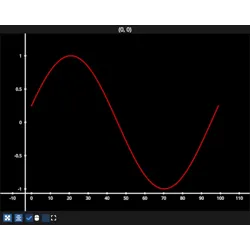
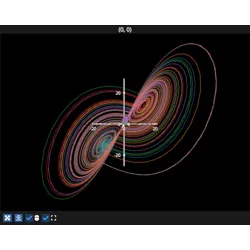
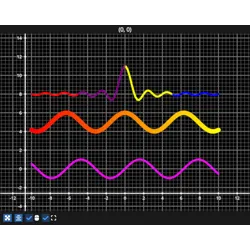
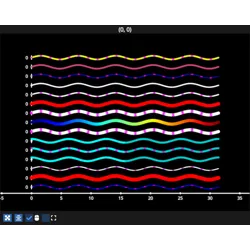
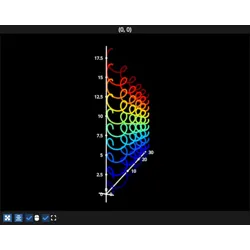
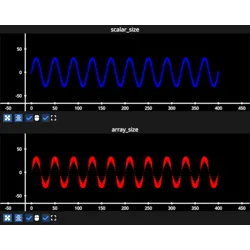
Line Examples#
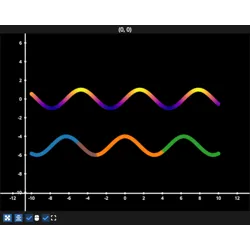
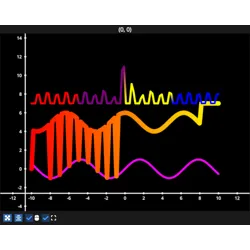
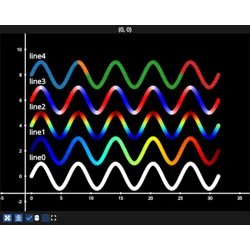
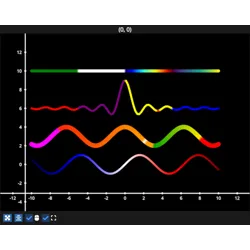
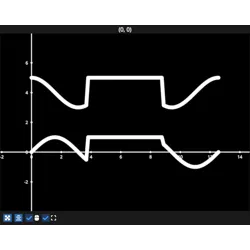
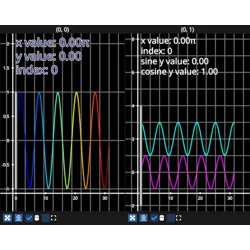
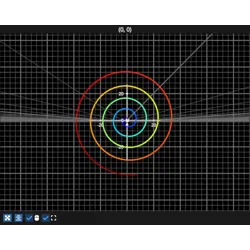
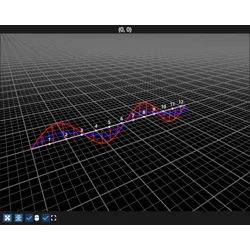
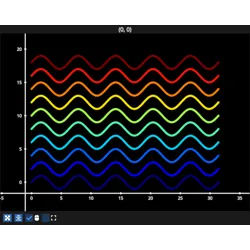
LineCollection Examples#

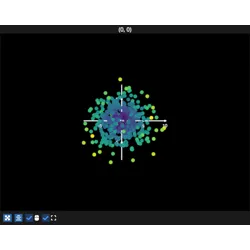
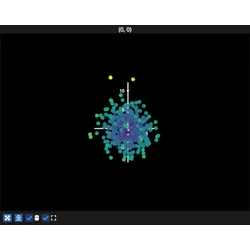
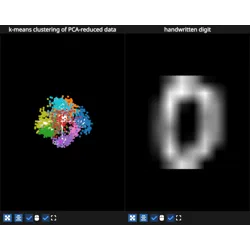
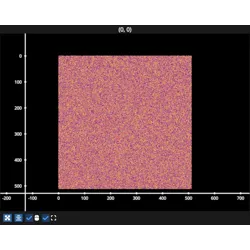
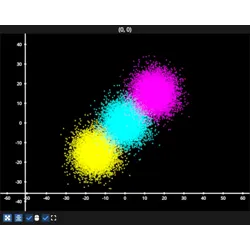
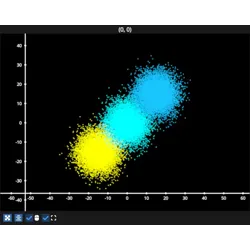
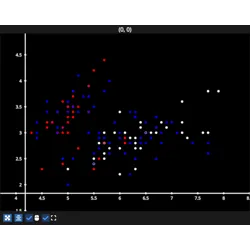
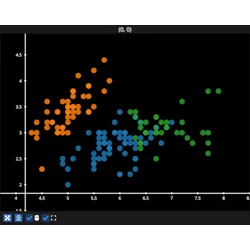
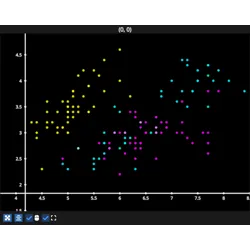
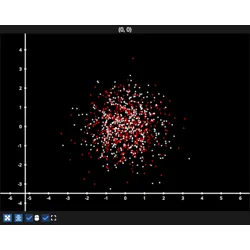
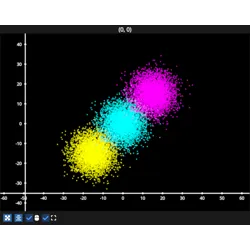
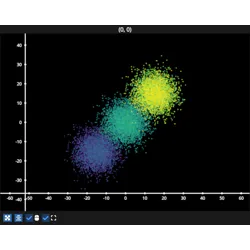
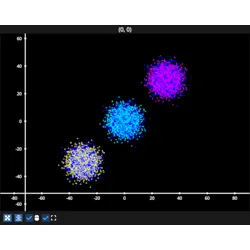
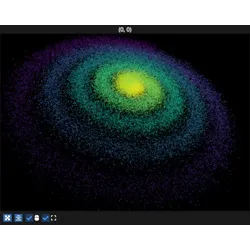
Scatter Examples#

Text Examples#
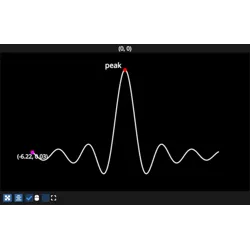
Events#
Several examples using events
Several examples using events