Note
Go to the end to download the full example code.
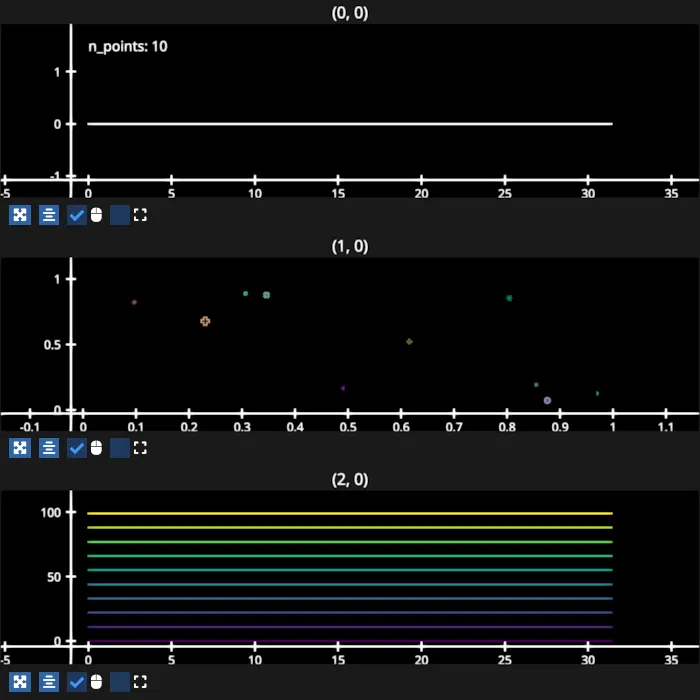
Change number of points in lines and scatters#
This example sets lines and scatters with new data of a different shape, i.e. new data with more or fewer datapoints. Internally, this creates new buffers for the feature that is being set (data, colors, markers, etc.). Note that there are performance drawbacks to doing this, so it is recommended to maintain the same number of datapoints in a graphic when possible. You only want to change the number of datapoints when it’s really necessary, and you don’t want to do it constantly (such as tens or hundreds of times per second).
This example is also useful for manually checking that GPU buffers are freed when they’re no longer in use. Run this example while monitoring VRAM usage with nvidia-smi
/home/runner/work/fastplotlib/fastplotlib/fastplotlib/graphics/features/_base.py:19: UserWarning: casting float64 array to float32
  warn(f"casting {array.dtype} array to float32")
# test_example = false


import numpy as np
import fastplotlib as fpl

# create some data to start with
xs = np.linspace(0, 10 * np.pi, 100)
ys = np.sin(xs)

data = np.column_stack([xs, ys])

# create a figure, add a line, scatter and line_stack
figure = fpl.Figure(shape=(3, 1), size=(700, 700))

line = figure[0, 0].add_line(data)

scatter = figure[1, 0].add_scatter(
    np.random.rand(100, 3),
    colors=np.random.rand(100, 4),
    markers=np.random.choice(list("osD+x^v<>*"), size=100),
    sizes=(np.random.rand(100) + 1) * 3,
    edge_colors=np.random.rand(100, 4),
    point_rotations=np.random.rand(100) * 180,
    uniform_marker=False,
    uniform_size=False,
    uniform_edge_color=False,
    point_rotation_mode="vertex",
)

line_stack = figure[2, 0].add_line_stack(np.stack([data] * 10), cmap="viridis")

text = figure[0, 0].add_text(f"n_points: {100}", offset=(0, 1.5, 0), anchor="middle-left")

figure.show(maintain_aspect=False)

i = 0


def update():
    # set a new larger or smaller data array on every render
    global i

    # create new data
    freq = np.abs(np.sin(i)) * 10
    n_points = int((freq * 20_000) + 10)

    xs = np.linspace(0, 10 * np.pi, n_points)
    ys = np.sin(xs * freq)

    new_data = np.column_stack([xs, ys])

    # update line data
    line.data = new_data

    # update scatter data, colors, markers, etc.
    scatter.data = np.random.rand(n_points, 3)
    scatter.colors = np.random.rand(n_points, 4)
    scatter.markers = np.random.choice(list("osD+x^v<>*"), size=n_points)
    scatter.edge_colors = np.random.rand(n_points, 4)
    scatter.point_rotations = np.random.rand(n_points) * 180

    # update line stack data
    line_stack.data = np.stack([new_data] * 10)

    text.text = f"n_points: {n_points}"

    i += 0.01


figure.add_animations(update)

# NOTE: fpl.loop.run() should not be used for interactive sessions
# See the "JupyterLab and IPython" section in the user guide
if __name__ == "__main__":
    print(__doc__)
    fpl.loop.run()
Total running time of the script: (0 minutes 38.742 seconds)