Note
Go to the end to download the full example code.
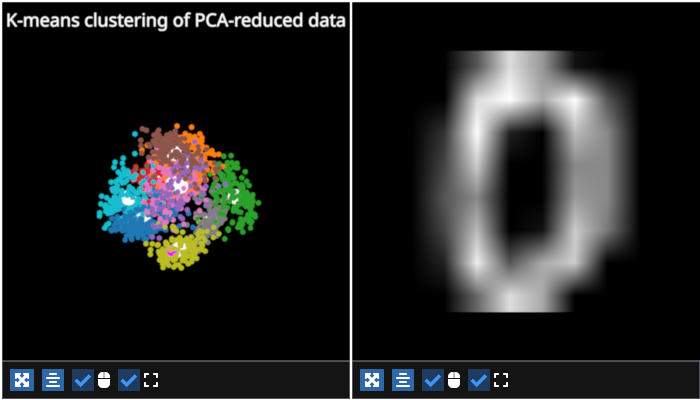
K-Means Clustering of MNIST Dataset#
Example showing how you can perform K-Means clustering on the MNIST dataset.
/opt/hostedtoolcache/Python/3.12.9/x64/lib/python3.12/site-packages/pygfx/objects/_ruler.py:267: RuntimeWarning: divide by zero encountered in divide
  screen_full = (ndc_full[:, :2] / ndc_full[:, 3:4]) * half_canvas_size
/opt/hostedtoolcache/Python/3.12.9/x64/lib/python3.12/site-packages/pygfx/objects/_ruler.py:267: RuntimeWarning: invalid value encountered in divide
  screen_full = (ndc_full[:, :2] / ndc_full[:, 3:4]) * half_canvas_size
/opt/hostedtoolcache/Python/3.12.9/x64/lib/python3.12/site-packages/pygfx/objects/_ruler.py:279: RuntimeWarning: invalid value encountered in divide
  screen_sel = (ndc_sel[:, :2] / ndc_sel[:, 3:4]) * half_canvas_size
/home/runner/work/fastplotlib/fastplotlib/fastplotlib/graphics/_features/_base.py:18: UserWarning: casting float64 array to float32
  warn(f"casting {array.dtype} array to float32")
# test_example = false

import fastplotlib as fpl
import numpy as np
from sklearn.datasets import load_digits
from sklearn.cluster import KMeans
from sklearn.decomposition import PCA

# load the data
mnist = load_digits()

# get the data and labels
data = mnist['data'] # (1797, 64)
labels = mnist['target'] # (1797,)

# visualize the first 5 digits
# NOTE: this is just to give a sense of the dataset if you are unfamiliar,
# the more interesting visualization is below :D
fig_data = fpl.Figure(shape=(1, 5), size=(900, 300))

# iterate through each subplot
for i, subplot in enumerate(fig_data):
    # reshape each image to (8, 8)
    subplot.add_image(data[i].reshape(8,8), cmap="gray", interpolation="linear")
    # add the label as a title
    subplot.set_title(f"Label: {labels[i]}")
    # turn off the axes and toolbar
    subplot.axes.visible = False
    subplot.toolbar  = False

fig_data.show()

# project the data from 64 dimensions down to the number of unique digits
n_digits = len(np.unique(labels)) # 10

reduced_data = PCA(n_components=n_digits).fit_transform(data) # (1797, 10)

# performs K-Means clustering, take the best of 4 runs
kmeans = KMeans(n_clusters=n_digits, n_init=4)
# fit the lower-dimension data
kmeans.fit(reduced_data)

# get the centroids (center of the clusters)
centroids = kmeans.cluster_centers_

# plot the kmeans result and corresponding original image
figure = fpl.Figure(
    shape=(1,2),
    size=(700, 400),
    cameras=["3d", "2d"],
    controller_types=[["fly", "panzoom"]]
)

# set the axes to False
figure[0, 0].axes.visible = False
figure[0, 1].axes.visible = False

figure[0, 0].set_title(f"K-means clustering of PCA-reduced data")

# plot the centroids
figure[0, 0].add_scatter(
    data=np.vstack([centroids[:, 0], centroids[:, 1], centroids[:, 2]]).T,
    colors="white",
    sizes=15
)
# plot the down-projected data
digit_scatter = figure[0,0].add_scatter(
    data=np.vstack([reduced_data[:, 0], reduced_data[:, 1], reduced_data[:, 2]]).T,
    sizes=5,
    cmap="tab10", # use a qualitative cmap
    cmap_transform=kmeans.labels_, # color by the predicted cluster
)

# initial index
ix = 0

# plot the initial image
digit_img = figure[0, 1].add_image(
    data=data[ix].reshape(8,8),
    cmap="gray",
    name="digit",
    interpolation="linear"
)

# change the color and size of the initial selected data point
digit_scatter.colors[ix] = "magenta"
digit_scatter.sizes[ix] = 10

# define event handler to update the selected data point
@digit_scatter.add_event_handler("pointer_enter")
def update(ev):
    # reset colors and sizes
    digit_scatter.cmap = "tab10"
    digit_scatter.sizes = 5

    # update with new seleciton
    ix = ev.pick_info["vertex_index"]

    digit_scatter.colors[ix] = "magenta"
    digit_scatter.sizes[ix] = 10

    # update digit fig
    figure[0, 1]["digit"].data = data[ix].reshape(8, 8)

figure.show()

# NOTE: `if __name__ == "__main__"` is NOT how to use fastplotlib interactively
# please see our docs for using fastplotlib interactively in ipython and jupyter
if __name__ == "__main__":
    print(__doc__)
    fpl.loop.run()
Total running time of the script: (0 minutes 0.828 seconds)