Note
Go to the end to download the full example code.
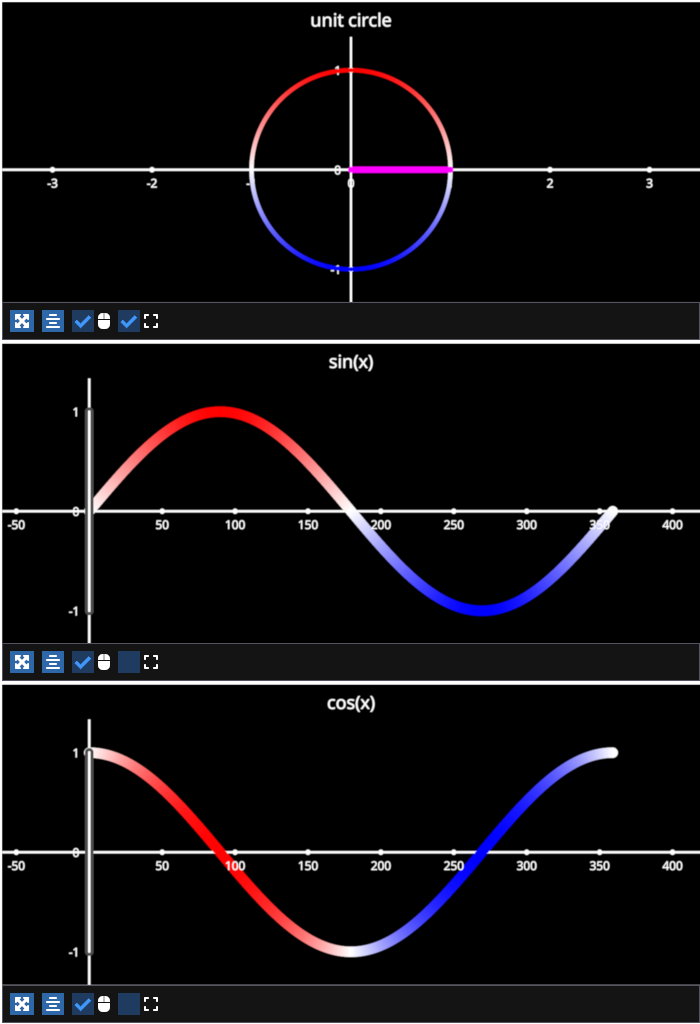
Unit circle#
Example with linear selectors on a sine and cosine function that demonstrates the unit circle.
This shows how fastplotlib supports bidirectional events, drag the linear selector on the sine or cosine function and they will both move together.
Click on the sine or cosine function to set the colormap transform to illustrate the sine or cosine function output values on the unit circle.
/home/runner/work/fastplotlib/fastplotlib/fastplotlib/graphics/_features/_base.py:18: UserWarning: casting float64 array to float32
  warn(f"casting {array.dtype} array to float32")
# test_example = false


import numpy as np
import fastplotlib as fpl


# helper function to make a cirlce
def make_circle(center, radius: float, n_points: int) -> np.ndarray:
    theta = np.linspace(0, 2 * np.pi, n_points)
    xs = radius * np.cos(theta)
    ys = radius * np.sin(theta)

    return np.column_stack([xs, ys]) + center


# create a figure with 3 subplots
figure = fpl.Figure((3, 1), names=["unit circle", "sin(x)", "cos(x)"], size=(700, 1024))

# set the axes to intersect at (0, 0, 0) to better illustrate the unit circle
for subplot in figure:
    subplot.axes.intersection = (0, 0, 0)

figure["sin(x)"].camera.maintain_aspect = False
figure["cos(x)"].camera.maintain_aspect = False

# create sine and cosine data
xs = np.linspace(0, 2 * np.pi, 360)
sine = np.sin(xs)
cosine = np.cos(xs)

# circle data
circle_data = make_circle(center=(0, 0), radius=1, n_points=360)

# make the circle line graphic, set the cmap transform using the sine function
circle_graphic = figure["unit circle"].add_line(
    circle_data, thickness=4, cmap="bwr", cmap_transform=sine
)

# line to show the circle radius
# use it to indicate the current position of the sine and cosine selctors (below)
radius_data = np.array([[0, 0, 0], [*circle_data[0], 0]])
circle_radius = figure["unit circle"].add_line(
    radius_data, thickness=6, colors="magenta"
)

# sine line graphic, cmap transform set from the sine function
sine_graphic = figure["sin(x)"].add_line(
    sine, thickness=10, cmap="bwr", cmap_transform=sine
)

# cosine line graphic, cmap transform set from the sine function
# illustrates the sine function values on the cosine graphic
cosine_graphic = figure["cos(x)"].add_line(
    cosine, thickness=10, cmap="bwr", cmap_transform=sine
)

# add linear selectors to the sine and cosine line graphics
sine_selector = sine_graphic.add_linear_selector()
cosine_selector = cosine_graphic.add_linear_selector()

def set_circle_cmap(ev):
    # sets the cmap transforms

    cmap_transform = ev.graphic.data[:, 1]  # y-val data of the sine or cosine graphic
    for g in [sine_graphic, cosine_graphic]:
        g.cmap.transform = cmap_transform

    # set circle cmap transform
    circle_graphic.cmap.transform = cmap_transform

# when the sine or cosine graphic is clicked, the cmap_transform
# of the sine, cosine and circle line graphics are all set from
# the y-values of the clicked line
sine_graphic.add_event_handler(set_circle_cmap, "click")
cosine_graphic.add_event_handler(set_circle_cmap, "click")


def set_x_val(ev):
    # used to sync the two selectors
    value = ev.info["value"]
    index = ev.get_selected_index()

    sine_selector.selection = value
    cosine_selector.selection = value

    circle_radius.data[1, :-1] = circle_data[index]

# add same event handler to both graphics
sine_selector.add_event_handler(set_x_val, "selection")
cosine_selector.add_event_handler(set_x_val, "selection")

figure.show()


# NOTE: `if __name__ == "__main__"` is NOT how to use fastplotlib interactively
# please see our docs for using fastplotlib interactively in ipython and jupyter
if __name__ == "__main__":
    print(__doc__)
    fpl.loop.run()
Total running time of the script: (0 minutes 0.933 seconds)