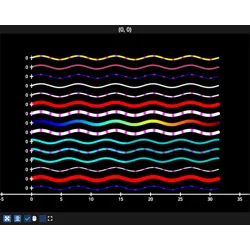
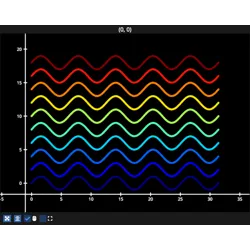
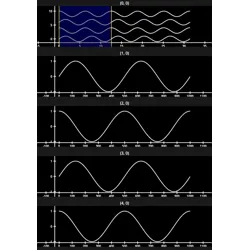
fastplotlib.LineStack#
- class LineStack(data, thickness=2.0, colors='w', cmap=None, cmap_transform=None, name=None, names=None, metadata=None, metadatas=None, separation=10.0, separation_axis='y', kwargs_lines=None, **kwargs)[source]#
Create a stack of
LineGraphicthat are separated along the “x” or “y” axis.- Parameters:
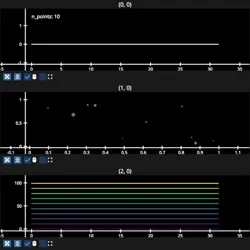
data (list of array-like) –
List or array-like of multiple line data to plot
iflisteach item in the list must be a 1D, 2D, or 3D numpy arrayif array-like, must be of shape [n_lines, n_points_line, y | xy | xyz]thickness (float or Iterable of float, default 2.0) –
iffloat, single thickness will be used for all linesiflistoffloat, each value will apply to the individual linescolors (str, RGBA array, Iterable of RGBA array, or Iterable of str, default "w") –
if singlestrsuch as “w”, “r”, “b”, etc, represents a single color for all linesif singleRGBA array(tuple or list of size 4), represents a single color for all linesiflistofstr, represents color for each individual line, example [“w”, “b”, “r”,…]ifRGBA arrayof shape [data_size, 4], represents a single RGBA array for each linecmap (Iterable of str or str, optional) –
ifstr, single cmap will be used for all linesiflistofstr, each cmap will apply to the individual linesNote
cmapoverrides any arguments passed tocolorscmap_transform (1D array-like of numerical values, optional) – if provided, these values are used to map the colors from the cmap
name (str, optional) – name of the line collection as a whole
names (list[str], optional) – names of the individual lines in the collection,
len(names)must equallen(data)metadata (Any) – metadata associated with the collection as a whole
metadatas (Iterable or array) – metadata for each individual line associated with this collection, this is for the user to manage.
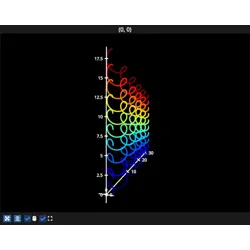
len(metadata)must be same aslen(data)separation (float, default 10) – space in between each line graphic in the stack
separation_axis (str, default "y") – axis in which the line graphics in the stack should be separated
- kwargs_lines: list[dict], optional
list of kwargs passed to the individual lines,
len(kwargs_lines)must equallen(data)- kwargs_collection
kwargs for the collection, passed to GraphicCollection