
Note
Go to the end to download the full example code.
Volume modes#
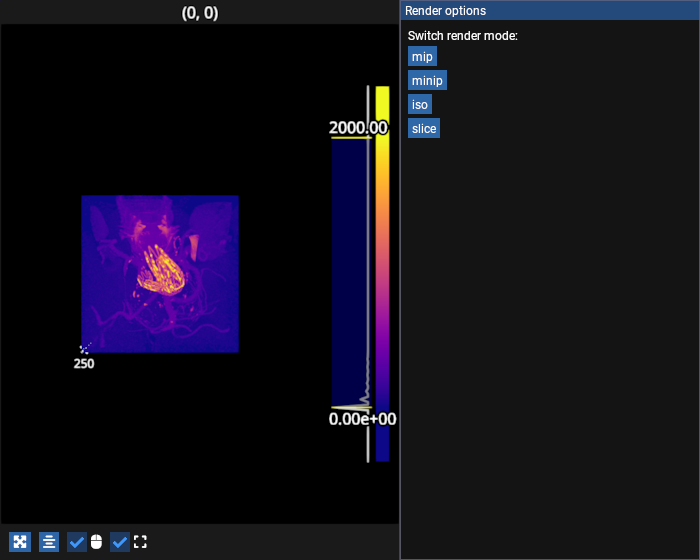
View a volume using different rendering modes.
# test_example = true

import numpy as np
import fastplotlib as fpl
from fastplotlib.ui import ImguiColorbar, ImguiWindow
from fastplotlib.graphics.features import VOLUME_RENDER_MODES
import imageio.v3 as iio
from imgui_bundle import imgui

voldata = iio.imread("imageio:stent.npz").astype(np.float32)

figure = fpl.Figure(
    cameras="3d",
    controller_types="orbit",
    size=(700, 560)
)

figure[0, 0].add_image_volume(voldata, name="vol-img")

# add a colorbar with a histogram of the volume data
colorbar = ImguiColorbar(
    graphics=figure[0, 0]["vol-img"], histogram=np.histogram(voldata, bins=100)
)
figure[0, 0].add_imgui_window(colorbar, location="right", size=100)


class GUI(ImguiWindow):
    def update(self):
        graphic: fpl.ImageVolumeGraphic = self._figure[0, 0]["vol-img"]

        imgui.text("Switch render mode:")

        # add buttons to switch between modes
        for mode in VOLUME_RENDER_MODES.keys():
            if imgui.button(mode):
                graphic.mode = mode

        # add sliders to change iso rendering properties
        if graphic.mode == "iso":
            _, graphic.threshold = imgui.slider_float(
                "threshold", v=graphic.threshold, v_max=255, v_min=1,
            )
            _, graphic.step_size = imgui.slider_float(
                "step_size", v=graphic.step_size, v_max=10.0, v_min=0.1,
            )
            _, graphic.substep_size = imgui.slider_float(
                "substep_size", v=graphic.substep_size, v_max=10.0, v_min=0.1,
            )

            col = imgui.ImVec4((*graphic.emissive.rgb, 1))
            _, graphic.emissive = imgui.color_picker3("emissive color", col=col)

        if graphic.mode == "slice":
            imgui.text("Select plane defined by:\nax + by + cz + d = 0")
            _, a = imgui.slider_float("a", v=graphic.plane[0], v_min=-1, v_max=1.0)
            _, b = imgui.slider_float("b", v=graphic.plane[1], v_min=-1, v_max=1.0)
            _, c = imgui.slider_float("c", v=graphic.plane[2], v_min=-1, v_max=1.0)

            largest_dim = max(graphic.data.value.shape)
            _, d = imgui.slider_float("d", v=graphic.plane[3], v_min=0, v_max=largest_dim * 2)

            graphic.plane = (a, b, c, d)

gui = GUI()
figure.add_imgui_window(gui, location="right", size=300, title="Render options")

figure.show()


# NOTE: fpl.loop.run() should not be used for interactive sessions
# See the "JupyterLab and IPython" section in the user guide
if __name__ == "__main__":
    print(__doc__)
    fpl.loop.run()
Total running time of the script: (0 minutes 0.375 seconds)