
Note
Go to the end to download the full example code.
Scatter validation#
Example that shows some scatter plot features for test validation.
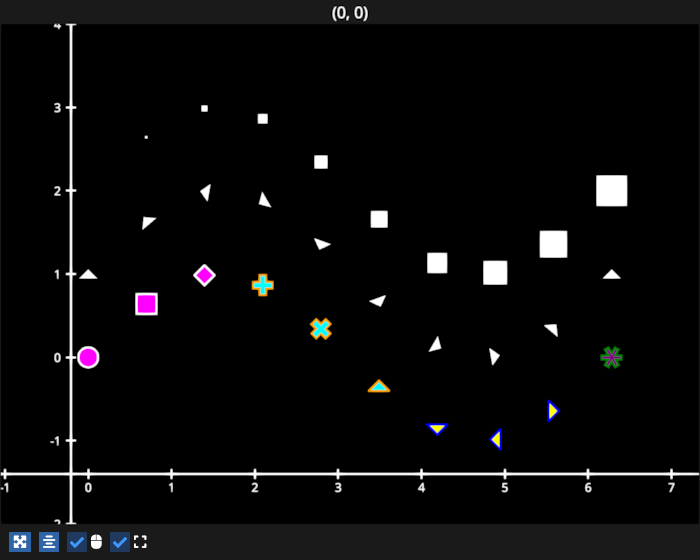
# test_example = true

import numpy as np
import fastplotlib as fpl
import imageio.v3 as iio

xs = np.linspace(0, 2 * np.pi, 10)

# make sine and cosine data
sine = np.column_stack([xs, np.sin(xs)])
cosine = np.column_stack([xs, np.cos(xs)])

# a simple image to display as the points
array = np.array([
    [1, 0, 1],
    [0, 1, 0],
    [1, 1, 1],
])

# load an image of Almar's cat
wikkie = np.flipud(iio.imread("imageio:wikkie.png"))

figure = fpl.Figure(
    size=(700, 560)
)

figure[0, 0].add_scatter(sine)

# combinations of per-point markers, colors and edge colors
figure[0, 0].add_scatter(
    sine,
    colors=["magenta"] * 3 + ["cyan"] * 3 + ["yellow"] * 3 + ["purple"],
    edge_colors=["w"] * 3 + ["orange"] * 3 + ["blue"] * 3 + ["green"],
    markers=list("osD+x^v<>*"),
    edge_width=2.0,
    sizes=20,
    point_rotations=0,
)


# per-point rotations
figure[0, 0].add_scatter(
    sine,
    markers="^",
    sizes=20,
    point_rotations=xs,
    offset=(0, 1, 0)
)


# point sizes
figure[0, 0].add_scatter(
    sine,
    markers="s",
    sizes=xs * 5,
    offset=(0, 2, 0),
    point_rotations=0,
)

figure.show()


# NOTE: fpl.loop.run() should not be used for interactive sessions
# See the "JupyterLab and IPython" section in the user guide
if __name__ == "__main__":
    print(__doc__)
    fpl.loop.run()
Total running time of the script: (0 minutes 0.489 seconds)