
Note
Go to the end to download the full example code.
Line Stack#
Example showing how to plot a stack of lines
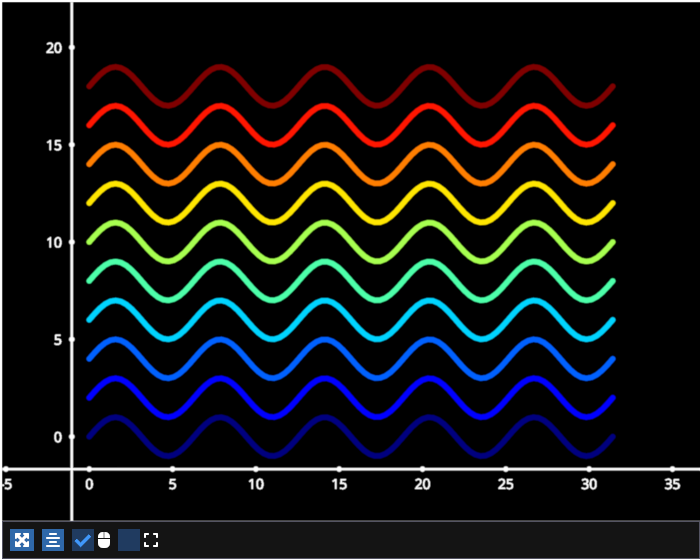
# test_example = true

import numpy as np
import fastplotlib as fpl
import cmap as cmap_lib
from itertools import repeat


xs = np.linspace(0, np.pi * 10, 100)
# sine wave
ys = np.sin(xs)

data = np.column_stack([xs, ys])
multi_data = np.stack([data] * 10)

figure = fpl.Figure(
    shape=(3, 1),
    size=(700, 1200),
)

# colormap per-line
line_stack = figure[0, 0].add_line_stack(
    multi_data,  # shape: (10, 100, 2), i.e. [n_lines, n_points, xy]
    cmap=["jet"] * 10,
    separation=(0, 0, 0),  # spacing between lines along each axis (x, y, z)
    separation_axis="y",
)

# colormap per-line with per-line transform
line_stack2 = figure[1, 0].add_line_stack(
    multi_data,  # shape: (10, 100, 2), i.e. [n_lines, n_points, xy]
    cmap=["bwr"] * 10,
    cmap_transform=np.broadcast_to(ys, (10, ys.size)),
    separation=(0, 0, 0),  # spacing between lines along each axis (x, y, z)
    separation_axis="y",
)

# colormap across-lines
line_stack3 = figure[2, 0].add_line_stack(
    multi_data,  # shape: (10, 100, 2), i.e. [n_lines, n_points, xy]
    cmap="viridis",
    separation=(0, 0, 0),  # spacing between lines along each axis (x, y, z)
    separation_axis="y",
)


figure.show(maintain_aspect=False)


# NOTE: fpl.loop.run() should not be used for interactive sessions
# See the "JupyterLab and IPython" section in the user guide
if __name__ == "__main__":
    print(__doc__)
    fpl.loop.run()
Total running time of the script: (0 minutes 0.693 seconds)