
Note
Go to the end to download the full example code.
Image Colormap#
Example showing simple plot creation and subsequent cmap change with a standard image from imageio.
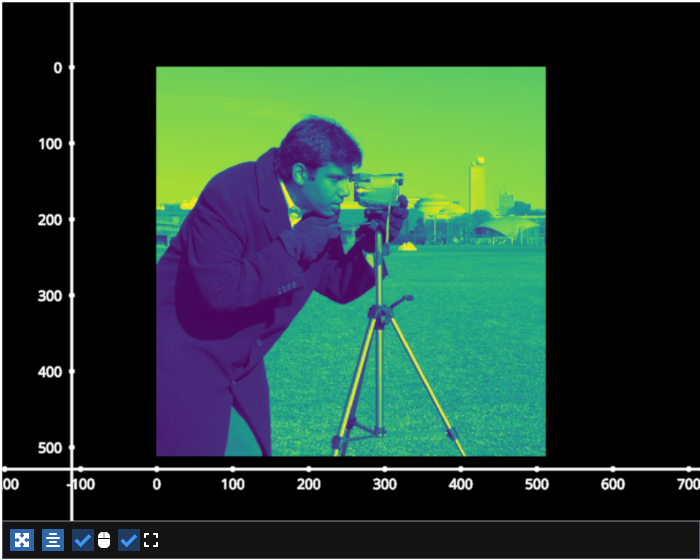
# test_example = true

import imageio.v3 as iio

import fastplotlib as fpl
import cmap as cmap_lib

im = iio.imread("imageio:camera.png")

figure = fpl.Figure(size=(700, 560))

# plot the image data
image = figure[0, 0].add_image(data=im, name="random-image")

figure.show()

image.cmap = "viridis"

# create your own colormap using the cmap lib
image.cmap = cmap_lib.Colormap(["orange", "purple", "green"])

# NOTE: fpl.loop.run() should not be used for interactive sessions
# See the "JupyterLab and IPython" section in the user guide
if __name__ == "__main__":
    print(__doc__)
    fpl.loop.run()
Total running time of the script: (0 minutes 0.344 seconds)