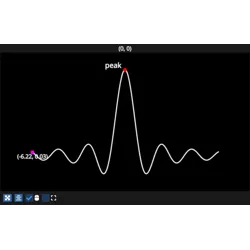
fastplotlib.LineGraphic#
- class LineGraphic(data, thickness=2.0, colors='w', cmap=None, cmap_transform=None, cmap_range=None, size_space='screen', dash_pattern=(), thin=False, **kwargs)[source]#
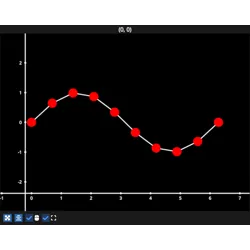
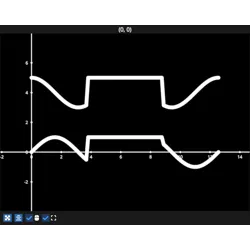
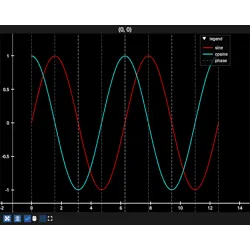
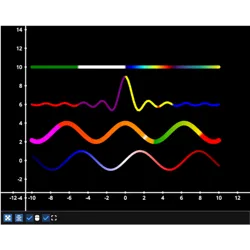
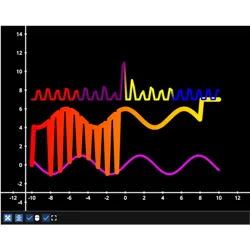
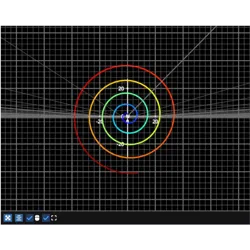
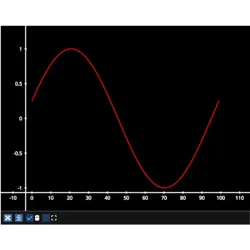
Create a line Graphic, 2d or 3d
- Parameters:
data (array-like) – Line data to plot. Can provide 1D, 2D, or a 3D data. | If passing a 1D array, it is used to set the y-values and the x-values are generated as an integer range from [0, data.size] | 2D data must be of shape [n_points, 2]. 3D data must be of shape [n_points, 3]
thickness (float, optional, default 2.0) – thickness of the line
colors (ColorLike or MultiColorLike, default "w") – specify colors as a single human-readable string, a single RGBA array, or a Sequence (array, tuple, or list) of strings or RGBA arrays
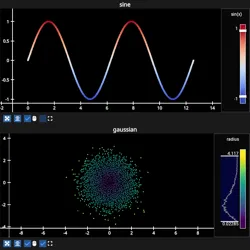
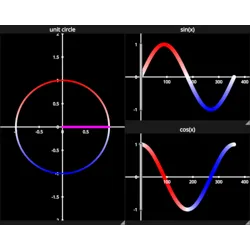
cmap (ColormapLike, optional) – Apply a colormap to the line instead of assigning colors manually, this overrides any argument passed to “colors”. For supported colormaps see the
cmaplibrary catalogue: https://cmap-docs.readthedocs.io/en/stable/catalog/cmap_transform (np.ndarray, optional) – 1D array-like of numerical values, if provided, these values are used to map the colors from the cmap
cmap_range ((float, float), optional) – the (min, max) of the cmap_transform mapped onto the colormap, defaults to the transform’s own range
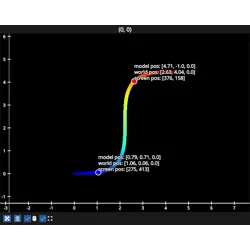
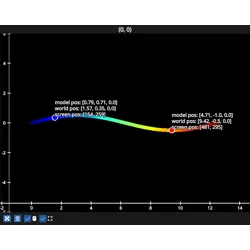
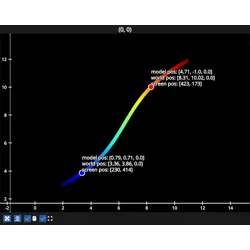
size_space (str, default "screen") – coordinate space in which the thickness is expressed (“screen”, “world”, “model”)
dash_pattern (str, tuple, or list, default ()) – The dash pattern. May be a matplotlib-style string, one of
"-", "--", "-.", ":"or"solid", "dashed", "dashdot", "dotted", or a sequence of floats describing the length of strokes and gaps. Ignored whenthinis True.thin (bool, default False) – Use the more performant thin line material, which is always one physical pixel wide. Thickness, dashing, and anti-aliasing are ignored when True.
**kwargs – passed to
Graphic