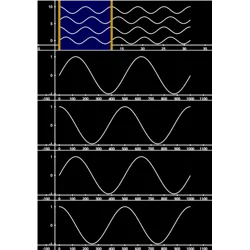
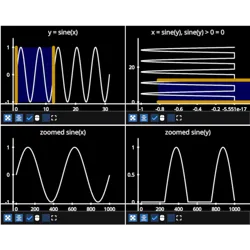
fastplotlib.LinearRegionSelector#
- class LinearRegionSelector(selection, limits, size, center, axis='x', parent=None, resizable=True, fill_color=(0, 0, 0.35), edge_color='yellow', edge_thickness=1.0, arrow_keys_modifier='Shift', extra_width=14.0, name=None)[source]#
Create a LinearRegionSelector graphic which can be moved only along either the x-axis or y-axis. Allows sub-selecting data from a parent
Graphicor from multiple Graphics.Assumes that the data under the selector is a function of the axis on which the selector moves along. Example: if the selector is along the x-axis, then there must be only one y-value for each x-value, otherwise methods such as
get_selected_data()do not make sense.- Parameters:
selection ((float, float)) – initial (min, max) x or y values
limits ((float, float)) – (min limit, max limit) within which the selector can move
size (int) – usually the data range, height or width of the selector
center (float) – usually the data mean, center offset of the selector on the orthogonal axis
axis (str, default "x") – “x” | “y”, axis along which the selector can move
parent (
Graphicinstance, defaultNone) – associate this selector with a parentGraphicfrom which to fetch data or indicesresizable (bool) – if
True, the edges can be dragged to change the range of the selectionfill_color (str, array, or tuple) – fill color for the selector, passed to pygfx.Color
edge_color (str, array, or tuple) – edge color for the selector, passed to pygfx.Color
edge_thickness (float, default 8) – edge thickness
arrow_keys_modifier (str) – modifier key that must be pressed to initiate movement using arrow keys, must be one of: “Control”, “Shift”, “Alt” or
Noneextra_width (float, default 14.0) – the width around the selector lines which is responsive to mouse events, in logical pixels
name (str, optional) – name of this selector graphic


