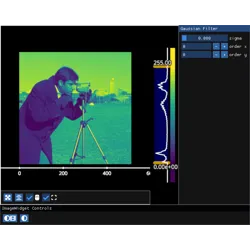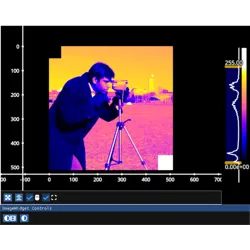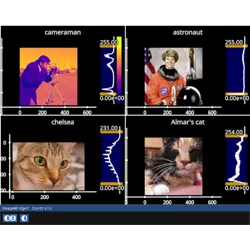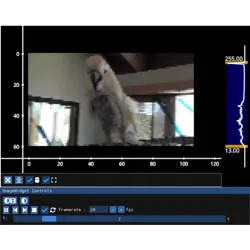
fastplotlib.ImageWidget#
- class ImageWidget(data, window_funcs=None, frame_apply=None, figure_shape=None, names=None, figure_kwargs=None, histogram_widget=True, rgb=None, cmap='plasma', graphic_kwargs=None)[source]#
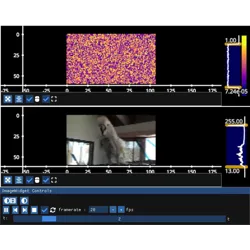
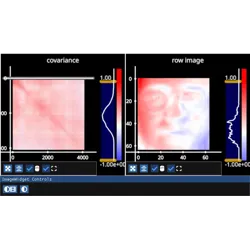
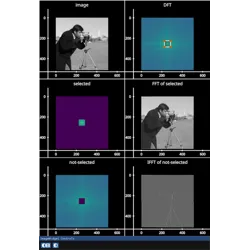
A high-level widget for navigating through image stacks. It is a thin wrapper around an
NDWidget, oneadd_nd_imageper array, with sliders for the “t” (time) and “z” dimensions shared across every image stack.Allowed dimension orders for each image stack, where the optional
(c)is an RGB(A) channel of size 3 or 4:n_dims
dims order
2
“xy(c)”
3
“txy(c)”
4
“tzxy(c)”
- Parameters:
data (np.ndarray | list[np.ndarray]) – array-like or a list of array-like, one image stack per subplot
window_funcs (dict[str, tuple[Callable, int]], optional) – Rolling window functions along the “t” and/or “z” dims,
{dim: (func, window_size)}, ex:{"t": (np.mean, 11)}.funcmust take anaxiskwarg,window_sizeis in frames.frame_apply (Callable | dict[int, Callable], optional) – Function(s) applied to each array’s slice before it is displayed. A single callable is applied to every subplot, a
{array_index: callable}dict applies per-array. Applied afterwindow_funcs.figure_shape (tuple[int, int], optional) – manually provide the
[n_rows, n_cols]shape for the figure, otherwise it is estimatedfigure_kwargs (dict, optional) – passed to the underlying
ImguiFigurehistogram_widget (bool, default
True) – make a histogram colorbar for each subplot to interactively set vmin, vmaxrgb (bool | list[bool], optional) – whether each array is RGB(A), i.e. the last dim is a channel of size 3 or 4
cmap (str, default "plasma") – colormap for the image graphics
graphic_kwargs (dict, optional) – passed to each
ImageGraphic