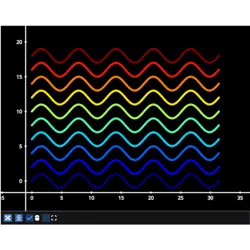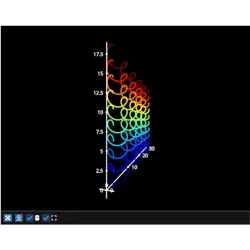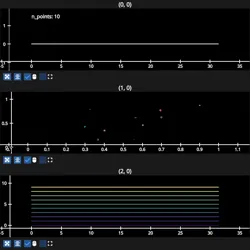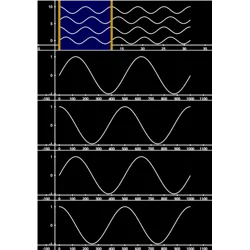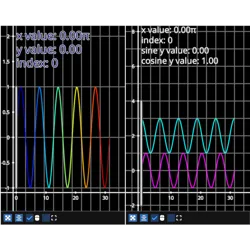
fastplotlib.LineStack#
- class LineStack(data, *, thickness=2.0, colors='w', cmap=None, cmap_transform=None, cmap_range=None, size_space='screen', dash_pattern=(), thin=False, names=None, offsets=None, rotations=None, scales=None, alphas=None, alpha_modes=None, visibles=None, metadatas=None, name=None, offset=(0.0, 0.0, 0.0), rotation=(0.0, 0.0, 0.0, 1.0), scale=(1.0, 1.0, 1.0), alpha=1.0, alpha_mode='auto', visible=True, metadata=None, separation=(0.0, 0.0, 0.0), separation_axis='y', steps=None)[source]#
Create a stack of graphics.
- Parameters:
data (list of array-like) – one entry per graphic; its length is the number of graphics in the stack
separation ((float, float, float), default (0.0, 0.0, 0.0)) – (x, y, z) gap between successive graphics, added to the step along the corresponding stacking axis
separation_axis (str, default "y") – axes to stack along, any combination of “x”, “y”, “z”, e.g. “y”, “xy”, “xyz”
steps ([n_graphics, 3] array-like, optional) – per-graphic step along each (x, y, z) axis, i.e. the max each graphic reaches. When
None(default) a single max over all the data sets one uniform step. When given, each graphic is offset by the cumulative step of the graphics before it, plusseparation.**kwargs – passed to the collection, e.g.
colors,thickness,sizes