Note
Go to the end to download the full example code.
Line collection slicing#
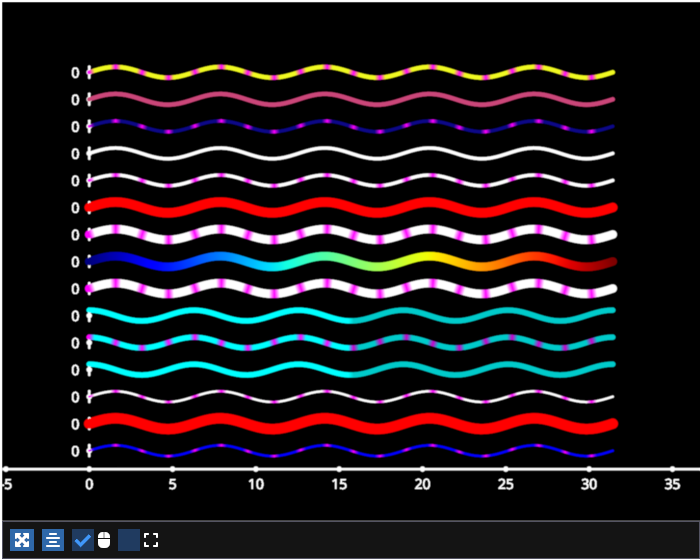
Example showing how to slice a line collection

/home/runner/work/fastplotlib/fastplotlib/fastplotlib/graphics/features/_base.py:18: UserWarning: casting float64 array to float32
  warn(f"casting {array.dtype} array to float32")
slice a collection to return a collection indexer
LineCollectionIndexer @ 0x7f665083cf50
Selection of <4> LineGraphic
collections supports fancy indexing!
LineCollectionIndexer @ 0x7f665083cf50
Selection of <5> LineGraphic
fancy index using properties of individual lines!
LineCollectionIndexer @ 0x7f665068cfb0
Selection of <2> LineGraphic
LineCollectionIndexer @ 0x7f665068cfb0
Selection of <4> LineGraphic
# test_example = true

import numpy as np
import fastplotlib as fpl


xs = np.linspace(0, np.pi * 10, 100)
# sine wave
ys = np.sin(xs)

data = np.column_stack([xs, ys])
multi_data = np.stack([data] * 15)


figure = fpl.Figure(size=(700, 560))

lines = figure[0, 0].add_line_stack(
    multi_data,
    thickness=[2, 10, 2, 5, 5, 5, 8, 8, 8, 9, 3, 3, 3, 4, 4],
    separation=4,
    metadatas=list(range(15)),  # some metadata
    names=list("abcdefghijklmno"),  # unique name for each line
)

print("slice a collection to return a collection indexer")
print(lines[1:5])  # lines 1, 2, 3, 4

print("collections supports fancy indexing!")
print(lines[::3])

print("fancy index using properties of individual lines!")
print(lines[lines.thickness < 3])
print(lines[lines.metadatas > 10])

# set line properties, such as data
# set y-values of lines 3, 4, 5
lines[3:6].data[:, 1] = np.cos(xs)
# set these same lines to a different color
lines[3:6].colors = "cyan"

# setting properties using fancy indexing
# set cmap along the line collection
lines[-3:].cmap = "plasma"

# set cmap of along a single line
lines[7].cmap = "jet"

# fancy indexing using line properties!
lines[lines.thickness > 8].colors = "r"
lines[lines.names == "a"].colors = "b"

# fancy index at the level of lines and individual line properties!
lines[::2].colors[::5] = "magenta"  # set every 5th point of every other line to magenta
lines[3:6].colors[50:, -1] = 0.6  # set half the points alpha to 0.6

figure.show(maintain_aspect=False)

# individual y axis for each line
for line in lines:
    line.add_axes()
    line.axes.x.visible = False
    line.axes.update_using_bbox(line.world_object.get_world_bounding_box())

# no y axis in subplot
figure[0, 0].axes.y.visible = False


if __name__ == "__main__":
    print(__doc__)
    fpl.loop.run()
Total running time of the script: (0 minutes 0.749 seconds)
