Note
Go to the end to download the full example code.
LinearRegionSelectors#
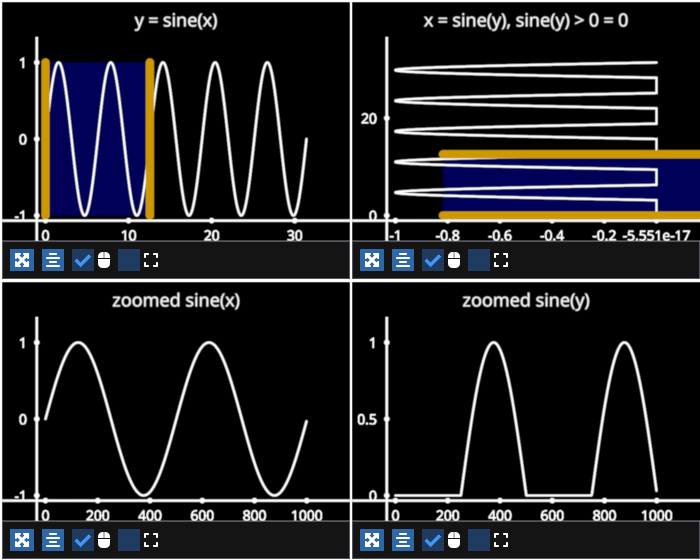
Example showing how to use a LinearRegionSelector with lines. We demonstrate two use cases, a horizontal LinearRegionSelector which selects along the x-axis and a vertical selector which moves along the y-axis.
In general, a horizontal selector on the x-axis is useful if you are displaying data where y = f(x). Conversely, a vertical selector that selectors along the y-axis is useful for displaying data where x = f(y). (ex: vertical histograms)

/home/runner/work/fastplotlib/fastplotlib/fastplotlib/graphics/features/_base.py:18: UserWarning: casting float64 array to float32
  warn(f"casting {array.dtype} array to float32")
# test_example = false

import fastplotlib as fpl
import numpy as np

# names for out subplots
names = [
    ["y = sine(x)", "x = sine(y), sine(y) > 0 = 0"],
    ["zoomed sine(x)", "zoomed sine(y)"]
]

# 2 rows, 2 columns
figure = fpl.Figure(
    (2, 2),
    size=(700, 560),
    names=names,
)

# preallocated number of datapoints for zoomed data
zoomed_prealloc = 5_000

# data to plot
xs = np.linspace(0, 200 * np.pi, 10_000)
ys = np.sin(xs) + np.random.normal(scale=0.2, size=10000)

# make sine along x axis
sine_x = figure[0, 0].add_line(np.column_stack([xs, ys]), thickness=1)

# x = sine(y), sine(y) > 0 = 0
sine_y_data = ys
sine_y_data[sine_y_data > 0] = 0

# sine along y axis
sine_y = figure[0, 1].add_line(np.column_stack([ys, xs]))

# offset the position of the graphic to demonstrate `get_selected_data()` later
sine_y.position_x = 50
sine_y.position_y = 50

# add linear selectors
selector_x = sine_x.add_linear_region_selector((0, 100))  # default axis is "x"
selector_y = sine_y.add_linear_region_selector(axis="y")

# preallocate array for storing zoomed in data
zoomed_init = np.column_stack([np.arange(zoomed_prealloc), np.zeros(zoomed_prealloc)])

# make line graphics for displaying zoomed data
zoomed_x = figure[1, 0].add_line(zoomed_init)
zoomed_y = figure[1, 1].add_line(zoomed_init)


def interpolate(subdata: np.ndarray, axis: int):
    """1D interpolation to display within the preallocated data array"""
    x = np.arange(0, zoomed_prealloc)
    xp = np.linspace(0, zoomed_prealloc, subdata.shape[0])

    # interpolate to preallocated size
    return np.interp(x, xp, fp=subdata[:, axis])  # use the y-values


@selector_x.add_event_handler("selection")
def set_zoom_x(ev):
    """sets zoomed x selector data"""
    # get the selected data
    selected_data = ev.get_selected_data()
    if selected_data.size == 0:
        # no data selected
        zoomed_x.data[:, 1] = 0
    else:
        # interpolate the y-values since y = f(x)
        zoomed_x.data[:, 1] = interpolate(selected_data, axis=1)
    figure[1, 0].auto_scale()


def set_zoom_y(ev):
    """sets zoomed x selector data"""
    # get the selected data
    selected_data = ev.get_selected_data()
    if selected_data.size == 0:
        # no data selected
        zoomed_y.data[:, 1] = 0
    else:
        # interpolate the x values since this x = f(y)
        zoomed_y.data[:, 1] = -interpolate(selected_data, axis=0)
    figure[1, 1].auto_scale()


# you can also add event handlers without a decorator
selector_y.add_event_handler(set_zoom_y, "selection")

# set initial selection
selector_x.selection = (0, 150)
selector_y.selection = (0, 150)

figure.show(maintain_aspect=False)

# NOTE: fpl.loop.run() should not be used for interactive sessions
# See the "JupyterLab and IPython" section in the user guide
if __name__ == "__main__":
    print(__doc__)
    fpl.loop.run()
Total running time of the script: (0 minutes 0.888 seconds)
