Note
Go to the end to download the full example code.
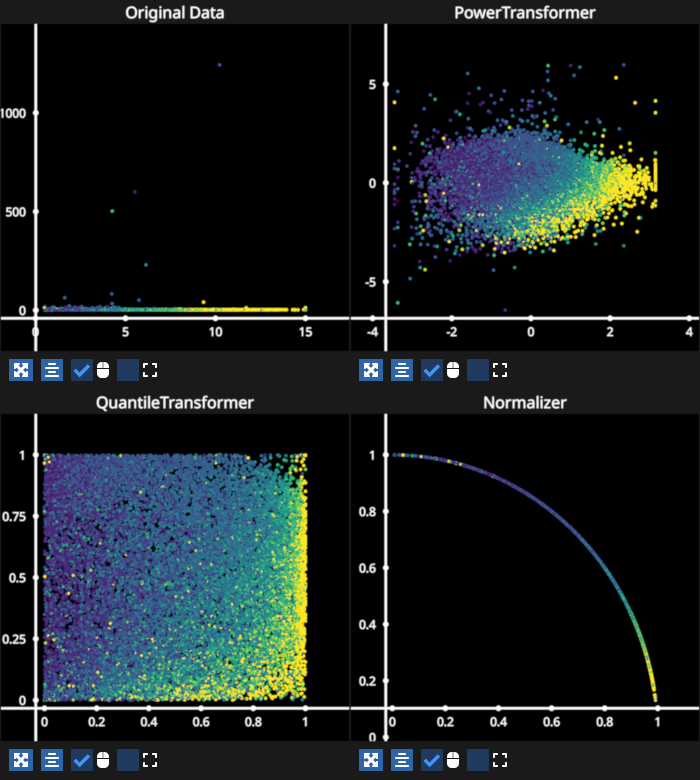
Scatter data explore scalers#
Based on the sklearn preprocessing scalers example. Hover points to highlight the corresponding point of the dataset transformed by the various scalers.
See: https://scikit-learn.org/stable/auto_examples/preprocessing/plot_all_scaling.html
This is another example that uses bi-directional events.
/home/runner/work/fastplotlib/fastplotlib/fastplotlib/graphics/features/_base.py:18: UserWarning: casting float64 array to float32
  warn(f"casting {array.dtype} array to float32")
/home/runner/work/fastplotlib/fastplotlib/fastplotlib/graphics/features/_base.py:18: UserWarning: casting float64 array to float32
  warn(f"casting {array.dtype} array to float32")
/opt/hostedtoolcache/Python/3.12.13/x64/lib/python3.12/site-packages/sklearn/preprocessing/_data.py:2905: UserWarning: n_quantiles (1000) is greater than the total number of samples (442). n_quantiles is set to n_samples.
  warnings.warn(
/home/runner/work/fastplotlib/fastplotlib/fastplotlib/graphics/features/_base.py:18: UserWarning: casting float64 array to float32
  warn(f"casting {array.dtype} array to float32")
/home/runner/work/fastplotlib/fastplotlib/fastplotlib/graphics/features/_base.py:18: UserWarning: casting float64 array to float32
  warn(f"casting {array.dtype} array to float32")
# test_example = false

from sklearn.datasets import load_diabetes
from sklearn.preprocessing import (
    StandardScaler,
    QuantileTransformer,
    PowerTransformer,
)

import fastplotlib as fpl
import pygfx

# get the dataset
dataset = load_diabetes(scaled=False)


# Take only 2 features to make visualization easier
X = dataset["data"][:, (2, 6)]
# target
y = dataset["target"]

# list of our scalers and their names as strings
scalers = [PowerTransformer, QuantileTransformer, StandardScaler]
names = ["Original Data", *[s.__name__ for s in scalers]]

# fastplotlib code starts here, make a figure
figure = fpl.Figure(
    shape=(2, 2),
    names=names,
    size=(700, 780),
)

scatters = list()  # list to store our 4 scatter graphics for convenience

# add a scatter of the original data
s = figure["Original Data"].add_scatter(
    data=X,
    cmap="viridis",
    cmap_transform=y,
    sizes=3,
)

# append to list of scatters
scatters.append(s)

# add the scaled data as scatter graphics
for scaler in scalers:
    name = scaler.__name__
    s = figure[name].add_scatter(scaler().fit_transform(X), cmap="viridis", cmap_transform=y, sizes=3)
    scatters.append(s)


# simple dict to restore the original scatter color and size
# of the previously clicked point upon clicking a new point
old_props = {"index": None, "size": None, "color": None}


def highlight_point(ev: pygfx.PointerEvent):
    # event handler to highlight the point when the mouse moves over it
    global old_props

    # the index of the point that was just clicked
    new_index = ev.pick_info["vertex_index"]

    # restore old point's properties
    if old_props["index"] is not None:
        old_index = old_props["index"]
        if new_index == old_index:
            # same point was clicked, ignore
            return
        for s in scatters:
            s.colors[old_index] = old_props["color"]
            s.sizes[old_index] = old_props["size"]

    # store the current property values of this new point
    old_props["index"] = new_index
    # all the scatters have the same colors and size for the corresponding index
    # so we can just use the first scatter's original color and size
    old_props["color"] = scatters[0].colors[new_index].copy()  # if you do not copy you will just get a view of the array!
    old_props["size"] = scatters[0].sizes[new_index]

    # highlight this new point
    for s in scatters:
        s.colors[new_index] = "magenta"
        s.sizes[new_index] = 15


# add the event handler to all the scatter graphics
for s in scatters:
    s.add_event_handler(highlight_point, "pointer_move")


figure.show(maintain_aspect=False)

# NOTE: fpl.loop.run() should not be used for interactive sessions
# See the "JupyterLab and IPython" section in the user guide
if __name__ == "__main__":
    print(__doc__)
    fpl.loop.run()
Total running time of the script: (0 minutes 0.735 seconds)