Note
Go to the end to download the full example code.
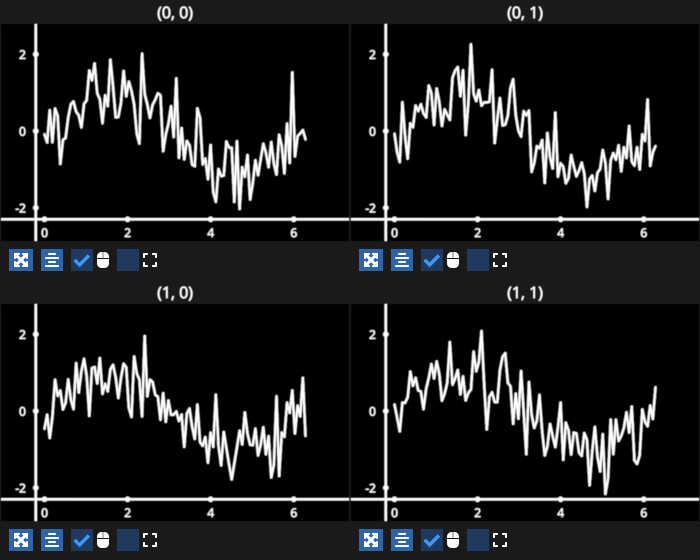
Sync subplots#
Use one controller for all subplots.
/home/runner/work/fastplotlib/fastplotlib/fastplotlib/graphics/features/_base.py:18: UserWarning: casting float64 array to float32
  warn(f"casting {array.dtype} array to float32")
# test_example = false

import numpy as np
import fastplotlib as fpl


xs = np.linspace(0, 2 * np.pi, 100)
ys = np.sin(xs)

figure = fpl.Figure(shape=(2, 2), controller_ids="sync", size=(700, 560))

for subplot in figure:
    subplot.add_line(np.column_stack([xs, ys + np.random.normal(scale=0.5, size=100)]))

figure.show(maintain_aspect=False)


# NOTE: fpl.loop.run() should not be used for interactive sessions
# See the "JupyterLab and IPython" section in the user guide
if __name__ == "__main__":
    print(__doc__)
    fpl.loop.run()
Total running time of the script: (0 minutes 0.584 seconds)