Note
Go to the end to download the full example code.
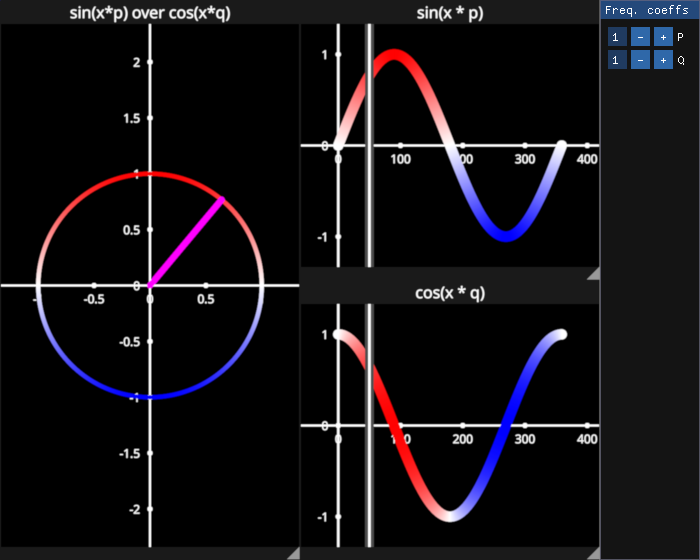
Sine and Cosine functions#
Identical to the Unit Circle example but you can change the angular frequencies using a UI
/home/runner/work/fastplotlib/fastplotlib/fastplotlib/graphics/features/_base.py:18: UserWarning: casting float64 array to float32
  warn(f"casting {array.dtype} array to float32")
# test_example = false

import numpy as np
import fastplotlib as fpl
from fastplotlib.ui import EdgeWindow
from imgui_bundle import imgui


# initial frequency coefficients for sine and cosine functions
P = 1
Q = 1


# helper function to make a circle
def make_circle(center, radius: float, p, q, n_points: int) -> np.ndarray:
    theta = np.linspace(0, 2 * np.pi, n_points)
    xs = radius * np.cos(theta * p)
    ys = radius * np.sin(theta * q)

    return np.column_stack([xs, ys]) + center


# we can define this layout using "extents", i.e. min and max ranges on the canvas
# (x_min, x_max, y_min, y_max)
# extents can be defined as fractions as shown here
extents = [
    (0, 0.5, 0, 1),  # circle subplot
    (0.5, 1, 0, 0.5),  # sine subplot
    (0.5, 1, 0.5, 1),  # cosine subplot
]

# create a figure with 3 subplots
figure = fpl.Figure(
    extents=extents,
    names=["circle", "sin", "cos"],
    size=(700, 560)
)

# set more descriptive figure titles
figure["circle"].title = "sin(x*p) over cos(x*q)"
figure["sin"].title = "sin(x * p)"
figure["cos"].title = "cos(x * q)"

# set the axes to intersect at (0, 0, 0) to better illustrate the unit circle
for subplot in figure:
    subplot.axes.intersection = (0, 0, 0)
    subplot.toolbar = False  # reduce clutter

figure["sin"].camera.maintain_aspect = False
figure["cos"].camera.maintain_aspect = False

# create sine and cosine data
xs = np.linspace(0, 2 * np.pi, 360)
sine_data = np.sin(xs * P)
cosine_data = np.cos(xs * Q)

# circle data
circle_data = make_circle(center=(0, 0), p=P, q=Q, radius=1, n_points=360)

# make the circle line graphic, set the cmap transform using the sine function
circle = figure["circle"].add_line(
    circle_data, thickness=4, cmap="bwr", cmap_transform=sine_data
)

# line to show the circle radius
# use it to indicate the current position of the sine and cosine selctors (below)
radius_data = np.array([[0, 0, 0], [*circle_data[0], 0]])
circle_radius = figure["circle"].add_line(
    radius_data, thickness=6, colors="magenta"
)

# sine line graphic, cmap transform set from the sine function
sine = figure["sin"].add_line(
    sine_data, thickness=10, cmap="bwr", cmap_transform=sine_data
)

# cosine line graphic, cmap transform set from the sine function
# illustrates the sine function values on the cosine graphic
cosine = figure["cos"].add_line(
    cosine_data, thickness=10, cmap="bwr", cmap_transform=sine_data
)

# add linear selectors to the sine and cosine line graphics
sine_selector = sine.add_linear_selector()
cosine_selector = cosine.add_linear_selector()


def set_circle_cmap(ev):
    # sets the cmap transforms

    cmap_transform = ev.graphic.data[:, 1]  # y-val data of the sine or cosine graphic
    for g in [sine, cosine]:
        g.cmap.transform = cmap_transform

    # set circle cmap transform
    circle.cmap.transform = cmap_transform

# when the sine or cosine graphic is clicked, the cmap_transform
# of the sine, cosine and circle line graphics are all set from
# the y-values of the clicked line
sine.add_event_handler(set_circle_cmap, "click")
cosine.add_event_handler(set_circle_cmap, "click")


def set_x_val(ev):
    # used to sync the two selectors
    value = ev.info["value"]
    index = ev.get_selected_index()

    sine_selector.selection = value
    cosine_selector.selection = value

    circle_radius.data[1, :-1] = circle_data[index]

# add same event handler to both graphics
sine_selector.add_event_handler(set_x_val, "selection")
cosine_selector.add_event_handler(set_x_val, "selection")

# initial selection value
sine_selector.selection = 50


class GUIWindow(EdgeWindow):
    def __init__(self, figure, size, location, title):
        super().__init__(figure=figure, size=size, location=location, title=title)

        self._p = 1
        self._q = 1

    def _set_data(self):
        global sine, cosine, circle, circle_radius, circle_data

        # make new data
        sine_data = np.sin(xs * self._p)
        cosine_data = np.cos(xs * self._q)
        circle_data = make_circle(center=(0, 0), p=self._p, q=self._q, radius=1, n_points=360)


        # set the graphics
        sine.data[:, 1] = sine_data
        cosine.data[:, 1] = cosine_data
        circle.data[:, :2] = circle_data
        circle_radius.data[1, :-1] = circle_data[sine_selector.get_selected_index()]

    def update(self):
        flag_set_data = False

        changed, self._p = imgui.input_int("P", v=self._p, step_fast=2)
        if changed:
            flag_set_data = True

        changed, self._q = imgui.input_int("Q", v=self._q, step_fast=2)
        if changed:
            flag_set_data = True

        if flag_set_data:
            self._set_data()


gui = GUIWindow(
    figure=figure,
    size=100,
    location="right",
    title="Freq. coeffs"
)

figure.add_gui(gui)

figure.show()


# NOTE: fpl.loop.run() should not be used for interactive sessions
# See the "JupyterLab and IPython" section in the user guide
if __name__ == "__main__":
    print(__doc__)
    fpl.loop.run()
Total running time of the script: (0 minutes 0.635 seconds)