Note
Go to the end to download the full example code.
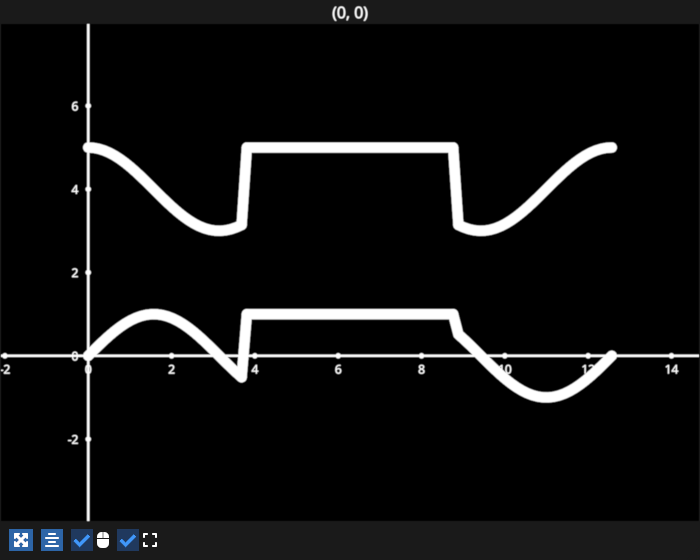
Events line data thickness#
Simple example of adding event handlers for line data and thickness.
/home/runner/work/fastplotlib/fastplotlib/fastplotlib/graphics/features/_base.py:18: UserWarning: casting float64 array to float32
  warn(f"casting {array.dtype} array to float32")
# test_example = false

import fastplotlib as fpl
import numpy as np

figure = fpl.Figure(size=(700, 560))

xs = np.linspace(0, 4 * np.pi, 100)
# sine wave
ys = np.sin(xs)
sine_data = np.column_stack([xs, ys])

# cosine wave
ys = np.cos(xs)
cosine_data = np.column_stack([xs, ys])

# create line graphics
sine = figure[0, 0].add_line(data=sine_data)
cosine = figure[0, 0].add_line(data=cosine_data, offset=(0, 4, 0))

# make a list of the line graphics for convenience
lines = [sine, cosine]


def change_thickness(ev: fpl.GraphicFeatureEvent):
    # sets thickness of all the lines
    new_value = ev.info["value"]

    for g in lines:
        g.thickness = new_value


def change_data(ev: fpl.GraphicFeatureEvent):
    # sets data of all the lines using the given event and value from the event

    # the user's slice/index
    # This can be a single int index, a slice,
    # or even a numpy array of int or bool for fancy indexing!
    indices = ev.info["key"]

    # the new values to set at the given indices
    new_values = ev.info["value"]

    # set the data for all the lines
    for g in lines:
        g.data[indices] = new_values


# add the event handlers to the line graphics
for g in lines:
    g.add_event_handler(change_thickness, "thickness")
    g.add_event_handler(change_data, "data")


figure.show()
figure[0, 0].axes.intersection = (0, 0, 0)

# set the y-value of the middle 40 points of the sine graphic to 1
# after the sine_graphic sets its data, the event handlers will be called
# and therefore the cosine graphic will also set its data using the event data
sine.data[30:70, 1] = np.ones(40)

# set the thickness of the cosine graphic, this will trigger an event
# that causes the sine graphic's thickness to also be set from this value
cosine.thickness = 10

# NOTE: fpl.loop.run() should not be used for interactive sessions
# See the "JupyterLab and IPython" section in the user guide
if __name__ == "__main__":
    print(__doc__)
    fpl.loop.run()
Total running time of the script: (0 minutes 0.306 seconds)