Note
Go to the end to download the full example code.
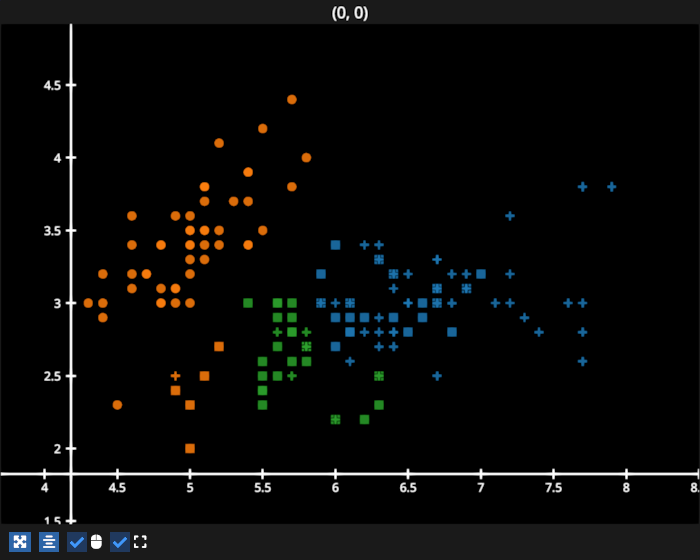
Iris Scatter Plot#
Example showing scatter plot using sklearn iris dataset.
/home/runner/work/fastplotlib/fastplotlib/fastplotlib/graphics/features/_base.py:18: UserWarning: casting float64 array to float32
  warn(f"casting {array.dtype} array to float32")
# test_example = true

import fastplotlib as fpl
import numpy as np
from sklearn.cluster import AgglomerativeClustering
from sklearn import datasets


figure = fpl.Figure(size=(700, 560))

data, target = datasets.load_iris(return_X_y=True)
data = data[:, :2]  # use only first 2 features

# map target class to scatter point marker
markers_map = {0: "o", 1: "s", 2: "+"}
markers = list(map(markers_map.get, target))

agg = AgglomerativeClustering(n_clusters=3)
agg.fit_predict(data)

clusters_labels = agg.labels_

scatter = figure[0, 0].add_scatter(
    data=data,
    sizes=10,
    alpha=0.7,
    cmap="tab10",
    cmap_transform=clusters_labels,
    markers=markers,
)

figure.show()


# NOTE: fpl.loop.run() should not be used for interactive sessions
# See the "JupyterLab and IPython" section in the user guide
if __name__ == "__main__":
    print(__doc__)
    fpl.loop.run()
Total running time of the script: (0 minutes 0.413 seconds)