Note
Go to the end to download the full example code.
Linear Selectors Image#
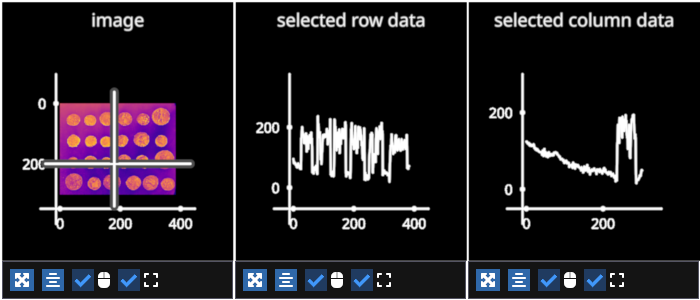
Example showing how to use a LinearSelector to select rows or columns of an image. The subplot on the right displays the data for the selector row and column. Move the selectors independently or click the middle mouse button to move both selectors to the clicked location.

# test_example = false

import fastplotlib as fpl
from imageio import v3 as iio

image_data = iio.imread("imageio:coins.png")

figure = fpl.Figure(
    (1, 3),
    size=(700, 300),
    names=[["image", "selected row data", "selected column data"]]
)

# create an image
image = figure[0, 0].add_image(image_data)

# add a row selector
image_row_selector = image.add_linear_selector(axis="y", edge_color="cyan")

# add column selector
image_col_selector = image.add_linear_selector(edge_color="cyan")

# make a line to indicate row data
line_image_row = figure[0, 1].add_line(image.data[0])

# make a line to indicate column data
line_image_col = figure[0, 2].add_line(image.data[:, 0])


# callbacks to change the line data in subplot [0, 1]
# to display selected row and selected column data
def image_row_selector_changed(ev):
    ix = ev.get_selected_index()
    new_data = image.data[ix]
    # set y values of line with the row data
    line_image_row.data[:, 1] = new_data


def image_col_selector_changed(ev):
    ix = ev.get_selected_index()
    new_data = image.data[:, ix]
    # set y values of line with the column data
    line_image_col.data[:, 1] = new_data


# add event handlers, you can also use a decorator
image_row_selector.add_event_handler(image_row_selector_changed, "selection")
image_col_selector.add_event_handler(image_col_selector_changed, "selection")

# programmatically set the selection or drag it with your mouse pointer
image_row_selector.selection = 200
image_col_selector.selection = 180

figure.show()

for subplot in figure:
    subplot.camera.zoom = 0.5


# NOTE: fpl.loop.run() should not be used for interactive sessions
# See the "JupyterLab and IPython" section in the user guide
if __name__ == "__main__":
    print(__doc__)
    fpl.loop.run()
Total running time of the script: (0 minutes 0.690 seconds)
