Note
Go to the end to download the full example code.
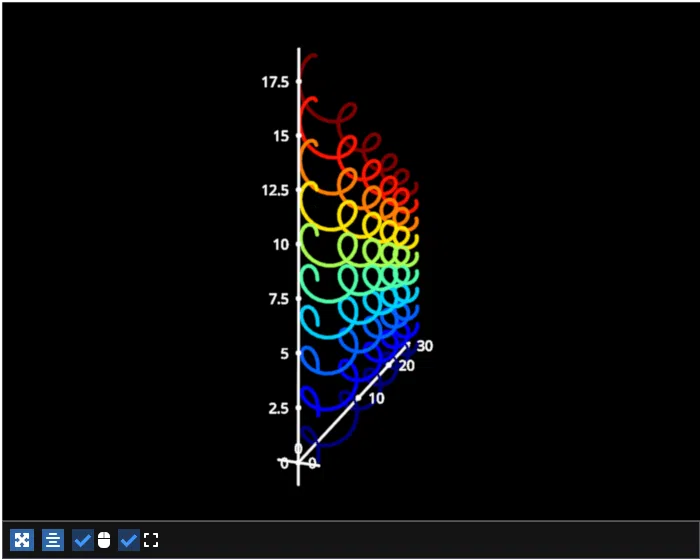
Line stack 3D#
Example showing a 3D stack of lines with animations
/opt/hostedtoolcache/Python/3.12.13/x64/lib/python3.12/site-packages/pygfx/objects/_ruler.py:400: RuntimeWarning: divide by zero encountered in divide
  screen_full = (ndc_full[:, :2] / ndc_full[:, 3:4]) * half_canvas_size
/opt/hostedtoolcache/Python/3.12.13/x64/lib/python3.12/site-packages/pygfx/objects/_ruler.py:400: RuntimeWarning: invalid value encountered in divide
  screen_full = (ndc_full[:, :2] / ndc_full[:, 3:4]) * half_canvas_size
/opt/hostedtoolcache/Python/3.12.13/x64/lib/python3.12/site-packages/pygfx/objects/_ruler.py:412: RuntimeWarning: invalid value encountered in divide
  screen_sel = (ndc_sel[:, :2] / ndc_sel[:, 3:4]) * half_canvas_size
/home/runner/work/fastplotlib/fastplotlib/fastplotlib/graphics/features/_base.py:18: UserWarning: casting float64 array to float32
  warn(f"casting {array.dtype} array to float32")
# test_example = false

import numpy as np
import fastplotlib as fpl


xs = np.linspace(0, np.pi * 10, 100)
# spiral
ys = np.sin(xs)
zs = np.cos(xs)

data = np.column_stack([xs, ys, zs])
multi_data = np.stack([data] * 10)

# create figure to plot lines and use an orbit controller in 3D
figure = fpl.Figure(cameras="3d", controller_types="orbit", size=(700, 560))

# make grid invisible to remove clutter
figure[0, 0].axes.grids.visible = False

line_stack = figure[0, 0].add_line_stack(
    multi_data,  # shape: (10, 100, 2), i.e. [n_lines, n_points, xy]
    cmap="jet",  # applied along n_lines
    thickness=3,
    separation=1,  # spacing between lines along the separation axis, default separation along "y" axis
    name="lines",
)


x_increment = 0.1


def animate_data(subplot):
    """animate with different rates of spinning the spirals"""
    global xs  # x vals
    global x_increment  # increment

    # calculate the new data
    # new a different spinning rate for each spiral
    # top ones will spin faster than the bottom ones
    new_xs = [xs + (factor * x_increment) for factor in np.linspace(0.5, 1.5, 10)]
    y = [np.sin(x) for x in new_xs]
    z = [np.cos(x) for x in new_xs]

    # iterate through collection and set data of each line
    for i, line in enumerate(subplot["lines"]):
        # set y and z values
        line.data[:, 1:] = np.column_stack([y[i], z[i]])

    x_increment += 0.1


colors_iteration = 0


def animate_colors(subplot):
    """animate the colors"""
    global colors_iteration

    # change the colors only on every 50th render cycle
    # otherwise it just looks like flickering because it's too fast :)
    if colors_iteration % 50 != 0:
        colors_iteration += 1
        return

    # use cmap_transform to shift the cmap
    cmap_transform = np.roll(np.arange(10), shift=int(colors_iteration / 50))

    # set cmap with the transform
    subplot["lines"].cmap = "jet", cmap_transform

    colors_iteration += 1


figure[0, 0].add_animations(animate_data, animate_colors)

# just a pre-saved camera state
camera_state = {
    "position": np.array([-18.0, 9.0, 8.0]),
    "rotation": np.array([0.00401791, -0.5951809, 0.00297593, 0.80357619]),
    "scale": np.array([1.0, 1.0, 1.0]),
    "reference_up": np.array([0.0, 1.0, 0.0]),
    "fov": 50.0,
    "width": 32,
    "height": 20,
    "zoom": 0.7,
    "maintain_aspect": True,
    "depth_range": None,
}

figure.show(maintain_aspect=False)

figure[0, 0].camera.set_state(camera_state)


# NOTE: fpl.loop.run() should not be used for interactive sessions
# See the "JupyterLab and IPython" section in the user guide
if __name__ == "__main__":
    print(__doc__)
    fpl.loop.run()
Total running time of the script: (0 minutes 5.751 seconds)