Note
Go to the end to download the full example code.
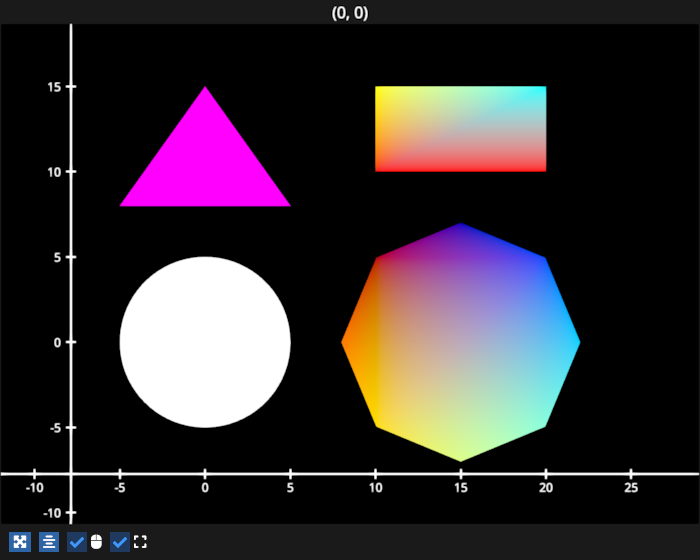
Polygons#
An example with polygons.
/home/runner/work/fastplotlib/fastplotlib/fastplotlib/graphics/features/_base.py:18: UserWarning: casting float64 array to float32
  warn(f"casting {array.dtype} array to float32")
# test_example = True

import fastplotlib as fpl
import numpy as np
from cmap import Colormap

figure = fpl.Figure(size=(700, 560))


def make_circle(center, radius: float, n_points: int = 75) -> np.ndarray:
    theta = np.linspace(0, 2 * np.pi, n_points, endpoint=False)
    xs = radius * np.sin(theta)
    ys = radius * np.cos(theta)

    return np.column_stack([xs, ys]) + np.asarray(center)[None]


# define vertices for some polygons
circle_data = make_circle(center=(0, 0), radius=5)
octogon_data = make_circle(center=(15, 0), radius=7, n_points=8)
rectangle_data = np.array([[10, 10], [20, 10], [20, 15], [10, 15]])
triangle_data = np.array(
    [
        [-5, 8],
        [5, 8],
        [0, 15],
        [-5, 8],
    ]
)

# add polygons
figure[0, 0].add_polygon(circle_data, name="circle")
figure[0, 0].add_polygon(
    octogon_data,
    colors=Colormap("jet").lut(8), # set vertex colors from jet cmap
    name="octogon"
)
figure[0, 0].add_polygon(
    rectangle_data,
    colors=["r", "r", "cyan", "y"], # manually specify vertex colors
    name="rectangle"
)
figure[0, 0].add_polygon(triangle_data, colors="m")

figure.show()


# NOTE: fpl.loop.run() should not be used for interactive sessions
# See the "JupyterLab and IPython" section in the user guide
if __name__ == "__main__":
    print(__doc__)
    fpl.loop.run()
Total running time of the script: (0 minutes 0.723 seconds)