Note
Go to the end to download the full example code.
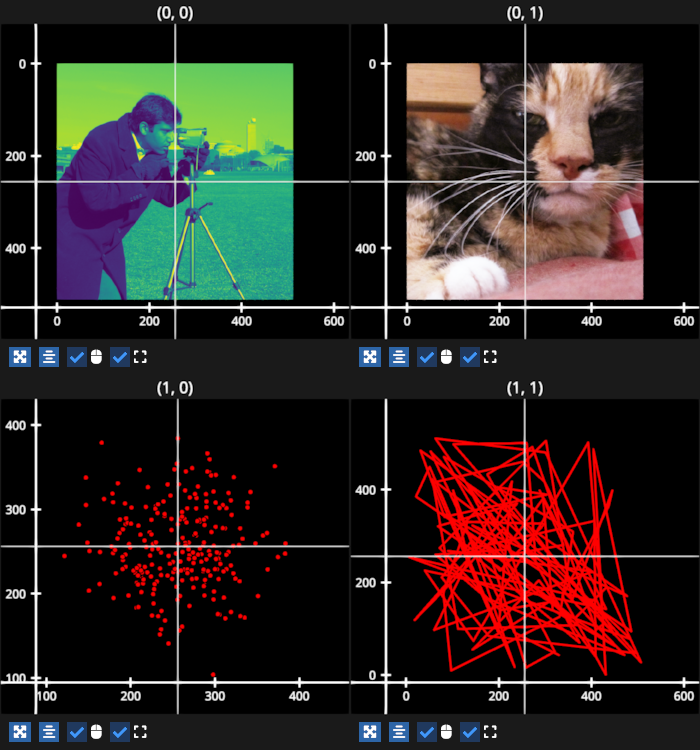
Cursor tool#
Example with multiple subplots and an interactive cursor that marks the same position in each subplot. Default crosshair mode.
/home/runner/work/fastplotlib/fastplotlib/fastplotlib/graphics/features/_base.py:18: UserWarning: casting float64 array to float32
  warn(f"casting {array.dtype} array to float32")
# test_example = False

import numpy as np
import fastplotlib as fpl
import imageio.v3 as iio


# get some data
img1 = iio.imread("imageio:camera.png")
img2 = iio.imread("imageio:wikkie.png")
scatter_data = np.random.normal(loc=256, scale=(50), size=(500)).reshape(250, 2)
line_data = np.random.rand(100, 2) * 512

# create a figure
figure = fpl.Figure(shape=(2, 2), size=(700, 750))

# plot data
figure[0, 0].add_image(img1, cmap="viridis")
figure[0, 1].add_image(img2)
figure[1, 0].add_scatter(scatter_data, sizes=5, colors="r")
figure[1, 1].add_line(line_data, colors="r")

# creator a cursor in crosshair mode
cursor = fpl.Cursor(color="w")

# add all subplots to the cursor
for subplot in figure:
    cursor.add_subplot(subplot)

# you can also set the cursor position programmatically
cursor.position = (256, 256)

figure.show()

# NOTE: fpl.loop.run() should not be used for interactive sessions
# See the "JupyterLab and IPython" section in the user guide
if __name__ == "__main__":
    print(__doc__)
    fpl.loop.run()
Total running time of the script: (0 minutes 1.203 seconds)