Note
Go to the end to download the full example code.
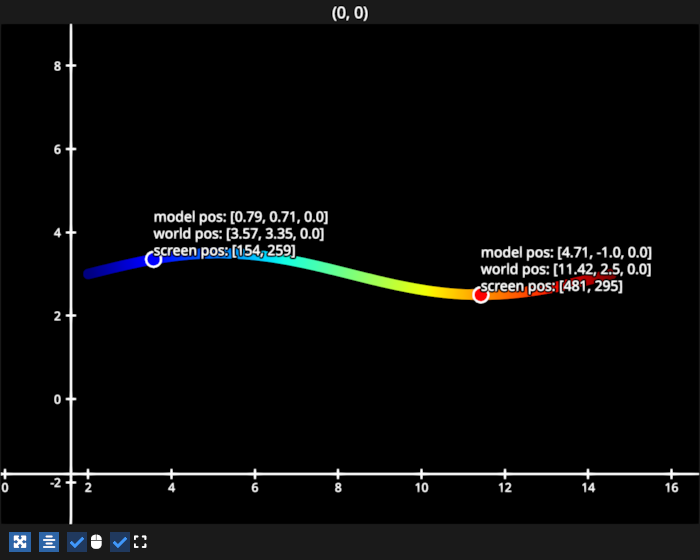
Translate and scale line#
This examples illustrates the various spaces that you may need to map between, plots a line to show these mappings.
/home/runner/work/fastplotlib/fastplotlib/fastplotlib/graphics/features/_base.py:18: UserWarning: casting float64 array to float32
  warn(f"casting {array.dtype} array to float32")
# test_example = true

import numpy as np
import fastplotlib as fpl

figure = fpl.Figure(size=(700, 560))

xs = np.linspace(0, 2 * np.pi, 100)
ys = np.sin(xs)

# a line to demonstrate some data in model/data space
line_data = np.column_stack([xs, ys])
line = figure[0, 0].add_line(line_data, cmap="jet", thickness=10)

# a scatter that will be in the same space as the line
# used to indicates a few points on the line
scatter_data = np.array([[np.pi / 4, np.sin(np.pi / 4)], [3 * np.pi / 2 , -1]])
scatter = figure[0, 0].add_scatter(
    scatter_data,
    sizes=15,
    colors=["blue", "red"],
    edge_colors="w",
    edge_width=2.0,
)

# text to indicate the scatter point positions in all spaces
text_0 = figure[0, 0].add_text(
    text="",
    anchor="bottom-left",
    face_color="w",
    outline_color="k",
    outline_thickness=0.5,
)
text_1 = figure[0, 0].add_text(
    text="",
    anchor="bottom-left",
    face_color="w",
    outline_color="k",
    outline_thickness=0.5,
)


# translation and scaling
translation = (2, 3, 0)  # x, y, z translation
line.offset = translation
scatter.offset = translation

scaling = (2, 0.5, 1.0)  # scale (x, y, z)
line.scale = scaling
scatter.scale = scaling


def update_text():
    # get the position of the scatter points in world space
    # graphics can map from model <-> world space
    point_0_world = scatter.map_model_to_world(scatter.data[0])
    point_1_world = scatter.map_model_to_world(scatter.data[1])

    # text is always just set in world space
    text_0.offset = point_0_world
    text_1.offset = point_1_world

    # use subplot to map to world <-> screen space
    point_0_screen = figure[0, 0].map_world_to_screen(point_0_world)
    point_1_screen = figure[0, 0].map_world_to_screen(point_1_world)

    # set text to display model, world and screen space position of the 2 points
    text_0.text = (
        f"model pos: [{', '.join(str(round(p, 2)) for p in scatter.data[0])}]\n"
        f"world pos: [{', '.join(str(round(p, 2)) for p in point_0_world)}]\n"
        f"screen pos: [{', '.join(str(round(p)) for p in point_0_screen)}]"
    )

    text_1.text = (
        f"model pos: [{', '.join(str(round(p, 2)) for p in scatter.data[1])}]\n"
        f"world pos: [{', '.join(str(round(p, 2)) for p in point_1_world)}]\n"
        f"screen pos: [{', '.join(str(round(p)) for p in point_1_screen)}]"
    )


figure.add_animations(update_text)

figure.show()

fpl.loop.run()
Total running time of the script: (0 minutes 0.437 seconds)