Note
Go to the end to download the full example code.
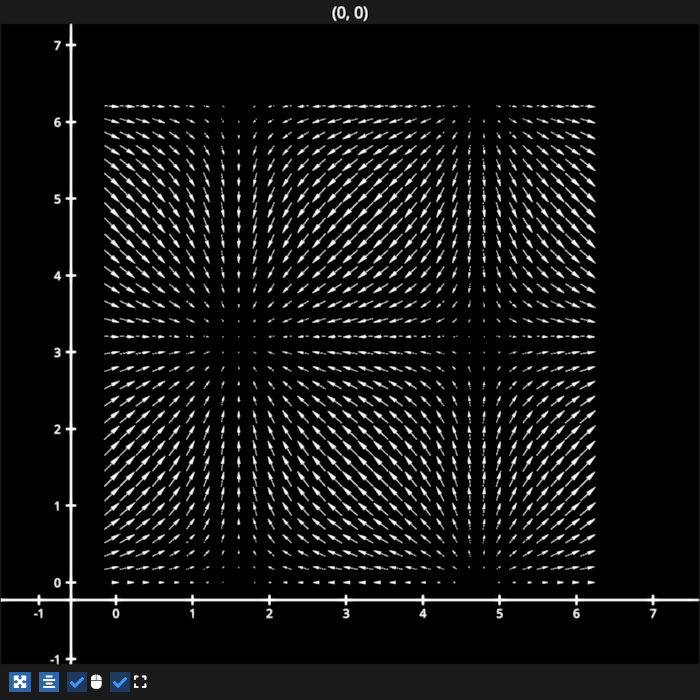
Simple Vectors#
Simple example with vectors. Similar to matplotlib quiver.
# test_example = true

import numpy as np
import fastplotlib as fpl

figure = fpl.Figure(size=(700, 700))

start, stop, step = 0, 2 * np.pi, 0.2

# get uniform x, y positions
x, y = np.meshgrid(np.arange(start, stop, step), np.arange(start, stop, step))

# vectors, u and v are x and y components indicating directions
u = np.cos(x)
v = np.sin(y)

# positions of each vector as [n_points, 2] array
positions = np.column_stack([x.ravel(), y.ravel()])
# directions of each vector as a [n_points, 2] array
directions = np.column_stack([u.ravel(), v.ravel()])


vectors = figure[0, 0].add_vectors(
    positions=positions,
    directions=directions,
)

figure.show()

# NOTE: fpl.loop.run() should not be used for interactive sessions
# See the "JupyterLab and IPython" section in the user guide
if __name__ == "__main__":
    print(__doc__)
    fpl.loop.run()
Total running time of the script: (0 minutes 0.766 seconds)