Note
Go to the end to download the full example code.
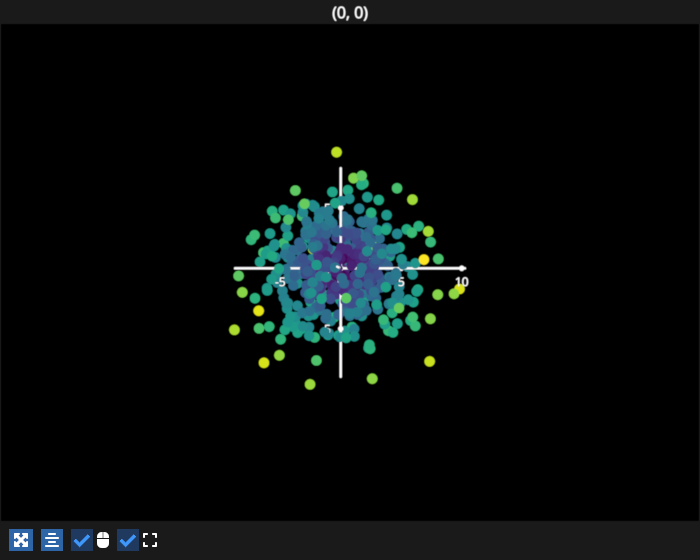
Scatter click#
Add an event handler to click on scatter points and highlight them, i.e. change the color and size of the clicked point. Fly around the 3D scatter using WASD keys and click on points to highlight them
/opt/hostedtoolcache/Python/3.12.13/x64/lib/python3.12/site-packages/pygfx/objects/_ruler.py:400: RuntimeWarning: divide by zero encountered in divide
  screen_full = (ndc_full[:, :2] / ndc_full[:, 3:4]) * half_canvas_size
/opt/hostedtoolcache/Python/3.12.13/x64/lib/python3.12/site-packages/pygfx/objects/_ruler.py:400: RuntimeWarning: invalid value encountered in divide
  screen_full = (ndc_full[:, :2] / ndc_full[:, 3:4]) * half_canvas_size
/opt/hostedtoolcache/Python/3.12.13/x64/lib/python3.12/site-packages/pygfx/objects/_ruler.py:412: RuntimeWarning: invalid value encountered in divide
  screen_sel = (ndc_sel[:, :2] / ndc_sel[:, 3:4]) * half_canvas_size
/home/runner/work/fastplotlib/fastplotlib/fastplotlib/graphics/features/_base.py:18: UserWarning: casting float64 array to float32
  warn(f"casting {array.dtype} array to float32")
# test_example = false

import numpy as np
import fastplotlib as fpl
import pygfx

# make a gaussian cloud
data = np.random.normal(loc=0, scale=3, size=1500).reshape(500, 3)

figure = fpl.Figure(cameras="3d", size=(700, 560))

scatter = figure[0, 0].add_scatter(
    data,  # the gaussian cloud
    sizes=10,  # some big points that are easy to click
    cmap="viridis",
    cmap_transform=np.linalg.norm(data, axis=1)  # color points using distance from origin
)

# simple dict to restore the original scatter color and size
# of the previously clicked point upon clicking a new point
old_props = {"index": None, "size": None, "color": None}


@scatter.add_event_handler("click")
def highlight_point(ev: pygfx.PointerEvent):
    global old_props

    # the index of the point that was just clicked
    new_index = ev.pick_info["vertex_index"]

    # restore old point's properties
    if old_props["index"] is not None:
        old_index = old_props["index"]
        if new_index == old_index:
            # same point was clicked, ignore
            return
        scatter.colors[old_index] = old_props["color"]
        scatter.sizes[old_index] = old_props["size"]

    # store the current property values of this new point
    old_props["index"] = new_index
    old_props["color"] = scatter.colors[new_index].copy()  # if you do not copy you will just get a view of the array!
    old_props["size"] = scatter.sizes[new_index]

    # highlight this new point
    scatter.colors[new_index] = "magenta"
    scatter.sizes[new_index] = 20


figure.show()


# NOTE: fpl.loop.run() should not be used for interactive sessions
# See the "JupyterLab and IPython" section in the user guide
if __name__ == "__main__":
    print(__doc__)
    fpl.loop.run()
Total running time of the script: (0 minutes 0.418 seconds)