Note
Go to the end to download the full example code.
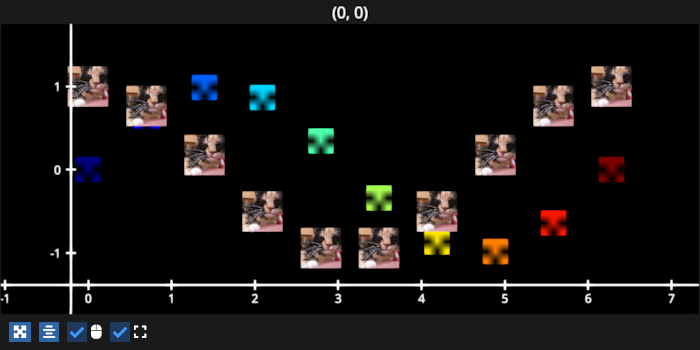
Scatter image as points#
Display a scatter using an image as the points. These are also called sprites.
/home/runner/work/fastplotlib/fastplotlib/fastplotlib/graphics/features/_base.py:18: UserWarning: casting float64 array to float32
  warn(f"casting {array.dtype} array to float32")
# test_example = true

import numpy as np
import fastplotlib as fpl
import imageio.v3 as iio


xs = np.linspace(0, 2 * np.pi, 10)

# make sine and cosine data
sine = np.column_stack([xs, np.sin(xs)])
cosine = np.column_stack([xs, np.cos(xs)])

# a simple image to display as the points
array = np.array([
    [1, 0, 1],
    [0, 1, 0],
    [1, 1, 1],
])

# load an image of Almar's cat
wikkie = np.flipud(iio.imread("imageio:wikkie.png"))

figure = fpl.Figure(size=(700, 350))

scatter = figure[0, 0].add_scatter(
    data=sine,
    mode="image",  # mode must be "image", otherwise the `image` arg is ignored and markers are used
    image=array,
    cmap="jet",  # the image is multiplied by the scatter point colors if provided
    sizes=25,
)

scatter2 = figure[0, 0].add_scatter(
    data=cosine,
    mode="image",
    image=wikkie,  # if an RGB(A) image is provided and no colors are provided, then the image is shown as-is
    sizes=40,
)

figure.show()

# NOTE: fpl.loop.run() should not be used for interactive sessions
# See the "JupyterLab and IPython" section in the user guide
if __name__ == "__main__":
    print(__doc__)
    fpl.loop.run()
Total running time of the script: (0 minutes 0.572 seconds)