Note
Go to the end to download the full example code.
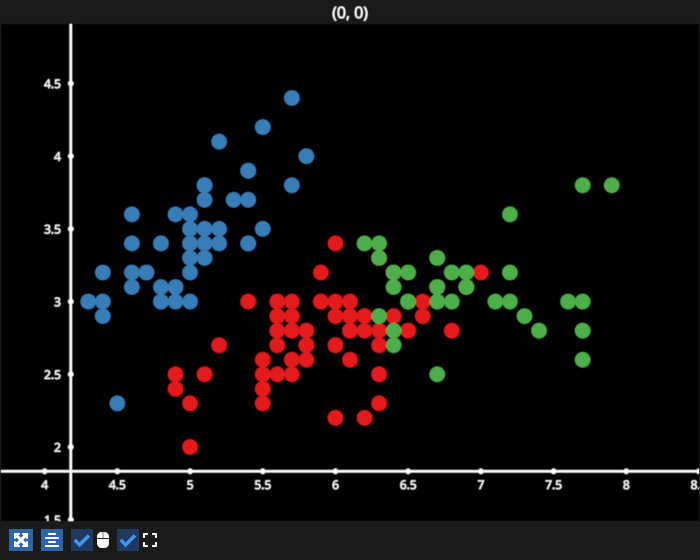
Tooltips Customization#
Customize the information displayed in a tooltip. This example uses the Iris dataset and sets the tooltip to display the species and cluster label of the point that is being hovered by the mouse pointer.
/home/runner/work/fastplotlib/fastplotlib/fastplotlib/graphics/features/_base.py:18: UserWarning: casting float64 array to float32
  warn(f"casting {array.dtype} array to float32")
# test_example = false


import fastplotlib as fpl
from sklearn.cluster import AgglomerativeClustering
from sklearn import datasets


figure = fpl.Figure(size=(700, 560))

dataset = datasets.load_iris()
data = dataset["data"]

agg = AgglomerativeClustering(n_clusters=3)
agg.fit_predict(data)

scatter = figure[0, 0].add_scatter(
    data=data[:, :-1],  # use only xy data
    sizes=15,
    cmap="Set1",
    cmap_transform=agg.labels_  # use the labels as a transform to map colors from the colormap
)


def tooltip_info(pick_info: dict) -> str:
    # get index of the scatter point that is being hovered
    index = pick_info["vertex_index"]

    # get the species name
    target = dataset["target"][index]
    cluster = agg.labels_[index]

    # the default formatting of the pick info
    default_info = scatter.format_pick_info(pick_info)

    info = (f"species: {dataset['target_names'][target]}\n"
            f"cluster: {cluster}\n\n"
            f"{default_info}")

    # return this string to display it in the tooltip
    return info


scatter.tooltip_format = tooltip_info

figure.show()


if __name__ == "__main__":
    print(__doc__)
    fpl.loop.run()
Total running time of the script: (0 minutes 0.324 seconds)