Note
Go to the end to download the full example code.
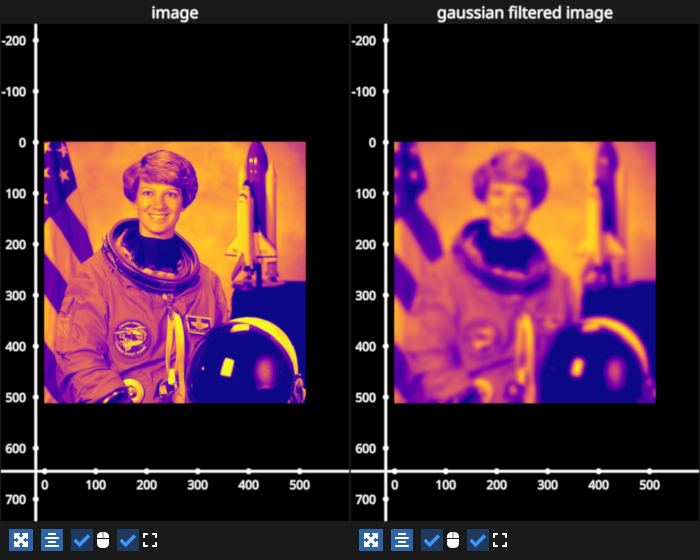
Image data event#
Example showing how to add an event handler to an ImageGraphic to capture when the data changes.
# test_example = false

import fastplotlib as fpl
import imageio.v3 as iio
from scipy.ndimage import gaussian_filter

rgb_weights = [0.299, 0.587, 0.114]

# load images, convert to grayscale
img1 = iio.imread("imageio:wikkie.png") @ rgb_weights
img2 = iio.imread("imageio:astronaut.png") @ rgb_weights

# Create a figure
figure = fpl.Figure(
    shape=(1, 2),
    size=(700, 560),
    names=["image", "gaussian filtered image"]
)

# create image graphics
image_raw = figure[0, 0].add_image(img1)
image_filt = figure[0, 1].add_image(gaussian_filter(img1, sigma=5))

# show the plot
figure.show()


# add event handler
@image_raw.add_event_handler("data")
def data_changed(ev: fpl.GraphicFeatureEvent):
    # get the new image data
    new_img = ev.info["value"]

    # set the filtered image graphic
    image_filt.data = gaussian_filter(new_img, sigma=5)


# set the data on the first image graphic
# this will trigger the `data_changed()` handler to be called
image_raw.data = img2


# NOTE: fpl.loop.run() should not be used for interactive sessions
# See the "JupyterLab and IPython" section in the user guide
if __name__ == "__main__":
    print(__doc__)
    fpl.loop.run()
Total running time of the script: (0 minutes 0.645 seconds)