Note
Go to the end to download the full example code.
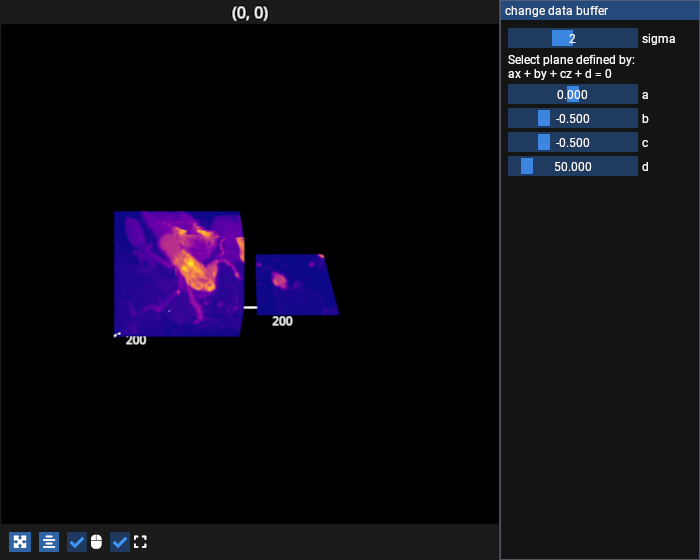
Volume share buffers#
Share the data buffer between two graphics. This example creates one Graphic using MIP rendering, and another graphic to display a slice of the volume. We can share the data buffer on the GPU between these graphics.
/opt/hostedtoolcache/Python/3.12.13/x64/lib/python3.12/site-packages/pygfx/objects/_ruler.py:400: RuntimeWarning: divide by zero encountered in divide
  screen_full = (ndc_full[:, :2] / ndc_full[:, 3:4]) * half_canvas_size
/opt/hostedtoolcache/Python/3.12.13/x64/lib/python3.12/site-packages/pygfx/objects/_ruler.py:400: RuntimeWarning: invalid value encountered in divide
  screen_full = (ndc_full[:, :2] / ndc_full[:, 3:4]) * half_canvas_size
/opt/hostedtoolcache/Python/3.12.13/x64/lib/python3.12/site-packages/pygfx/objects/_ruler.py:412: RuntimeWarning: invalid value encountered in divide
  screen_sel = (ndc_sel[:, :2] / ndc_sel[:, 3:4]) * half_canvas_size
# test_example = true

from imgui_bundle import imgui
import fastplotlib as fpl
from fastplotlib.ui import EdgeWindow
import imageio.v3 as iio
from skimage.filters import gaussian


data = iio.imread("imageio:stent.npz")


figure = fpl.Figure(
    cameras="3d",
    controller_types="orbit",
    size=(700, 560),
)

# MIP rendering is the default `mode`
vol_mip = figure[0, 0].add_image_volume(gaussian(data, sigma=2.0))

# make another graphic to show a slice of the volume
vol_slice = figure[0, 0].add_image_volume(
    vol_mip.data,  # pass the data property from the previous volume so they share the same buffer on the GPU
    mode="slice",
    plane=(0, -0.5, -0.5, 50),
    offset=(150, 0, 0)  # place the graphic at x=150
)


class GUI(EdgeWindow):
    def __init__(self, figure, title="change data buffer", location="right", size=200):
        super().__init__(figure, title=title, location=location, size=size)
        self._sigma = 2

    def update(self):
        changed, self._sigma = imgui.slider_int("sigma", v=self._sigma, v_min=0, v_max=5)

        if changed:
            vol_mip.data = gaussian(data, sigma=self._sigma)
            vol_mip.reset_vmin_vmax()
            vol_slice.reset_vmin_vmax()

        imgui.text("Select plane defined by:\nax + by + cz + d = 0")
        _, a = imgui.slider_float("a", v=vol_slice.plane[0], v_min=-1, v_max=1.0)
        _, b = imgui.slider_float("b", v=vol_slice.plane[1], v_min=-1, v_max=1.0)
        _, c = imgui.slider_float("c", v=vol_slice.plane[2], v_min=-1, v_max=1.0)

        largest_dim = max(vol_slice.data.value.shape)
        _, d = imgui.slider_float(
            "d", v=vol_slice.plane[3], v_min=0, v_max=largest_dim * 2
        )

        vol_slice.plane = (a, b, c, d)

gui = GUI(figure)
figure.add_gui(gui)

figure.show()


# NOTE: fpl.loop.run() should not be used for interactive sessions
# See the "JupyterLab and IPython" section in the user guide
if __name__ == "__main__":
    print(__doc__)
    fpl.loop.run()
Total running time of the script: (0 minutes 1.113 seconds)