fastplotlib.layouts.Figure#
- class Figure(shape=(1, 1), rects=None, extents=None, cameras='2d', controller_types=None, controller_ids=None, controllers=None, canvas=None, renderer=None, canvas_kwargs=None, size=(500, 300), names=None)[source]#
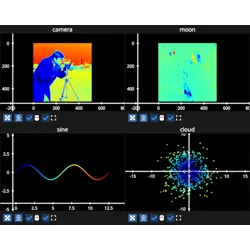
Create a Figure containing Subplots.
- Parameters:
shape (tuple[int, int], default (1, 1)) – shape [n_rows, n_cols] that defines a grid of subplots
rects (list of tuples or arrays, or a dict mapping subplot name -> rect) – list or dict of rects (x, y, width, height) that define the subplots. If it is a dict, the keys are used as the subplot names. rects can be defined in absolute pixels or as a fraction of the canvas. If width & height <= 1 the rect is assumed to be fractional. Conversely, if width & height > 1 the rect is assumed to be in absolute pixels. width & height must be > 0. Negative values are not allowed.
extents (list of tuples or arrays, or a dict mapping subplot name -> extent) –
list or dict of extents (xmin, xmax, ymin, ymax) that define the subplots. If it is a dict, the keys are used as the subplot names. extents can be defined in absolute pixels or as a fraction of the canvas. If xmax & ymax <= 1 the extent is assumed to be fractional. Conversely, if xmax & ymax > 1 the extent is assumed to be in absolute pixels. Negative values are not allowed. xmax - xmin & ymax - ymin must be > 0.
If both
rectsandextentsare provided, thenrectstakes precedence overextents, i.e.extentsis ignored whenrectsare also provided.cameras ("2d", "3d", list of "2d" | "3d", Iterable of camera instances, or Iterable of "2d" | "3d", optional) –
if str, one of"2d"or"3d"indicating 2D or 3D cameras for all subplotsIterable/list/array of2dand/or3dthat specifies the camera type for each subplotIterable/list/array of pygfx.PerspectiveCamera instancescontroller_types (str, Iterable, optional) – list/array that specifies the controller type for each subplot. Valid controller types: “panzoom”, “fly”, “trackball”, “orbit”. If not specified a default controller is chosen based on the camera type. Orthographic projections, i.e. “2d” cameras, use a “panzoom” controller by default. Perspective projections with a FOV > 0, i.e. “3d” cameras, use a “fly” controller by default.
controller_ids (str, list of int, np.ndarray of int, or list with sublists of subplot str names, optional) –
If None a unique controller is created for each subplotIf “sync” all the subplots use the same controllerThis allows custom assignment of controllers
Example with integers:sync first 2 plots, and sync last 2 plots: [[0, 0, 1], [2, 3, 3]]Example with str subplot names:list of lists of subplot names, each sublist is synced: [[subplot_a, subplot_b, subplot_e], [subplot_c, subplot_d]]this syncs subplot_a, subplot_b and subplot_e together; syncs subplot_c and subplot_d togethercontrollers (pygfx.Controller | list[pygfx.Controller] | np.ndarray[pygfx.Controller], optional) – Directly provide pygfx.Controller instances(s). Useful if you want to use a
Controllerfrom an existing subplot or aControlleryou have already instantiated. Also useful if you want to provide a customControllersubclass. Other controller kwargs, i.e.controller_typesandcontroller_idsare ignored if controllers are provided.canvas (str, BaseRenderCanvas, pygfx.Texture) – Canvas to draw the figure onto, usually auto-selected based on running environment.
renderer (pygfx.Renderer, optional) – pygfx renderer instance
canvas_kwargs (dict, optional) – kwargs to pass to the canvas
size ((int, int), optional) – starting size of canvas in absolute pixels, default (500, 300)
names (list or array of str, optional) – subplot names, ignored if extents or rects are provided as a dict