fastplotlib.ScatterGraphic#
- class ScatterGraphic(data, colors='w', uniform_color=False, cmap=None, cmap_transform=None, mode='markers', markers='o', uniform_marker=False, custom_sdf=None, edge_colors='black', uniform_edge_color=True, edge_width=1.0, image=None, point_rotations=0, point_rotation_mode='uniform', sizes=1, uniform_size=False, size_space='screen', isolated_buffer=True, **kwargs)[source]#
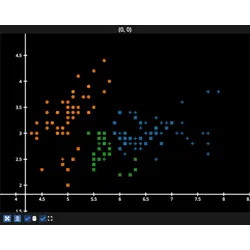
Create a Scatter Graphic, 2d or 3d
- Parameters:
data (array-like) – Scatter data to plot, Can provide 2D, or a 3D data. 2D data must be of shape [n_points, 2]. 3D data must be of shape [n_points, 3]
colors (str, array, tuple, list, Sequence, default "w") – specify colors as a single human-readable string, a single RGBA array, or a Sequence (array, tuple, or list) of strings or RGBA arrays
uniform_color (bool, default False) – if True, uses a uniform buffer for the scatter point colors. Useful if you need to save GPU VRAM when all points have the same color.
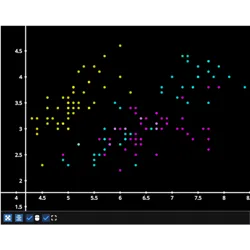
cmap (str, optional) – apply a colormap to the scatter instead of assigning colors manually, this overrides any argument passed to “colors”. For supported colormaps see the
cmaplibrary catalogue: https://cmap-docs.readthedocs.io/en/stable/catalog/cmap_transform (1D array-like or list of numerical values, optional) – if provided, these values are used to map the colors from the cmap
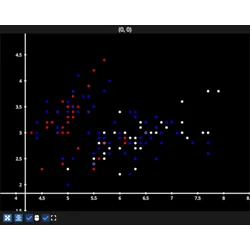
mode (one of: "markers", "simple", "gaussian", "image", default "markers") –
The scatter points mode, cannot be changed after the graphic has been created.
markers: represent points with various or custom markers, default
simple: all scatters points are simple circles
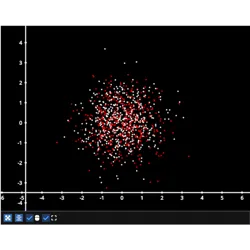
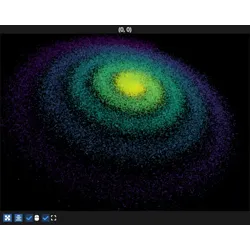
gaussian: each point is a gaussian blob
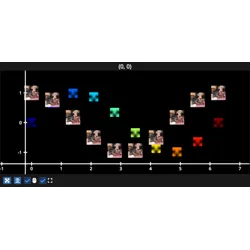
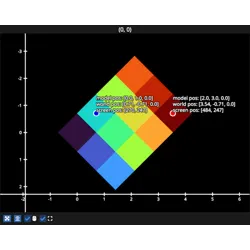
image: use an image for each point, pass an array to the image kwarg, these are also called sprites
markers (None | str | np.ndarray | Sequence[str], default "o") –
The shape of the markers when mode is “markers”
Supported values:
A string from pygfx.MarkerShape enum
Matplotlib compatible characters: “osD+x^v<>*”.
Unicode symbols: “●○■♦♥♠♣✳▲▼◀▶”.
Emojis: “❤️♠️♣️♦️💎💍✳️📍”.
A string containing the value “custom”. In this case, WGSL code defined by
custom_sdfwill be used.
uniform_marker (bool, default False) – Use the same marker for all points. Only valid when mode is “markers”. Useful if you need to use the same marker for all points and want to save GPU RAM.
custom_sdf (str = None,) –
The SDF code for the marker shape when the marker is set to custom. Can be used when mode is “markers”.
Negative values are inside the shape, positive values are outside the shape.
The SDF’s takes in two parameters coords: vec2<f32> and size: f32. The first is a WGSL coordinate and size is the overall size of the texture. The returned value should be the signed distance from any edge of the shape. Distances (positive and negative) that are less than half the edge_width in absolute terms will be colored with the edge_color. Other negative distances will be colored by colors.
edge_colors (str | np.ndarray | pygfx.Color | Sequence[float], default "black") – edge color of the markers, used when mode is “markers”
uniform_edge_color (bool, default True) – Set the same edge color for all markers. Useful for saving GPU RAM.
edge_width (float = 1.0,) – Width of the marker edges. used when mode is “markers”.
image (ArrayLike, optional) – renders an image at the scatter points, also known as sprites. The image color is multiplied with the point’s “normal” color.
point_rotations (float | ArrayLike = 0,) – The rotation of the scatter points in radians. Default 0. A single float rotation value can be set on all points, or an array of rotation values can be used to set per-point rotations
point_rotation_mode (one of: "uniform" | "vertex" | "curve", default "uniform") –
uniform: set the same rotation for every point, useful to save GPU RAM
vertex: set per-vertex rotations
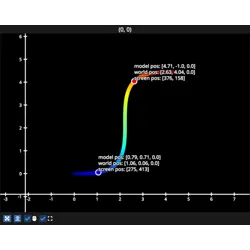
curve: The rotation follows the curve of the line defined by the points (in screen space)
sizes (float or iterable of float, optional, default 1.0) – sizes of the scatter points
uniform_size (bool, default False) – if True, uses a uniform buffer for the scatter point sizes. Useful if you need to save GPU VRAM when all points have the same size.
size_space (str, default "screen") – coordinate space in which the size is expressed, one of (“screen”, “world”, “model”)
isolated_buffer (bool, default True) – whether the buffers should be isolated from the user input array. Generally always
True,Falseis for rare advanced use if you have large arrays.kwargs – passed to
Graphic