fastplotlib.VectorsGraphic#
- class VectorsGraphic(positions, directions, color='w', size=None, vector_shape_options=None, **kwargs)[source]#
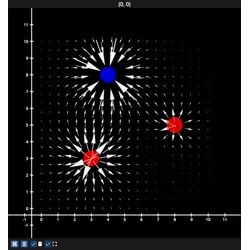
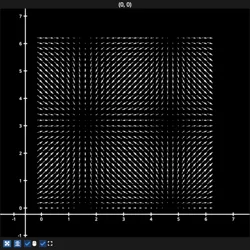
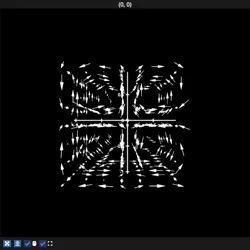
Create graphic that draw vectors. Similar to matplotlib quiver.
- Parameters:
positions (np.ndarray | Sequence[float]) – positions of the vectors, array-like, shape must be [n, 2] or [n, 3] where n is the number of vectors.
directions (np.ndarray | Sequence[float]) – directions of the vectors, array-like, shape must be [n, 2] or [n, 3] where n is the number of vectors.
spacing (float) – average distance between pairs of nearest-neighbor vectors, used for scaling
color (str | pygfx.Color | Sequence[float] | np.ndarray, default "w") – color of the vectors
size (float or None) – Size of a vector of magnitude 1 in world space for display purpose. Estimated from density if not provided.
vector_shape_options (dict) –
dict with the following fields that directly describes the shape of the vector arrows. Overrides
sizeargument.cone_radius
cone_height
stalk_radius
stalk_height
**kwargs – passed to
Graphic