fastplotlib.PolygonGraphic#
- class PolygonGraphic(data, mode='basic', colors='w', mapcoords=None, cmap=None, clim=None, **kwargs)[source]#
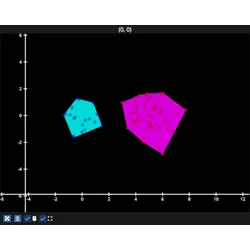
Create a polygon mesh graphic.
The data are always in the ‘xy’ plane. Set a rotation to display the polygon in another plane or in 3D space.
- Parameters:
data (array-like) – The polygon vertices, must be of shape: [n_vertices, 2]
mode (one of "basic", "phong", "slice", default "phong") –
basic: illuminate mesh with only ambient lighting
phong: phong lighting model, good for most use cases, see https://en.wikipedia.org/wiki/Phong_shading
colors (str, array, or iterable, default "w") – A uniform color, or the per-position colors.
mapcoords (array-like) – The per-position coordinates to which to apply the colormap (a.k.a. texcoords). These can e.g. be some domain-specific value (mapped to [0..1] using
clim). If not given, they will be the depth (z-coordinate) of the surface.cmap (str, optional) – Apply a colormap to the mesh, this overrides any argument passed to “colors”. For supported colormaps see the
cmaplibrary catalogue: https://cmap-docs.readthedocs.io/en/stable/catalog/ Both 1D and 2D colormaps are supported, though the mapcoords has to match the dimensionality.clim (tuple[float, float]) – The colormap limits. If the mapcoords has values between e.g. 5 and 90, you want to set the clim to e.g. (5, 90) or (0, 100) to determine how the values map onto the colormap.
**kwargs – passed to
Graphic