fastplotlib.NDImage#
- class NDImage(ref_index, nd_subplot, data, dims, display_dims, rgb_dim=None, window_funcs=None, window_order=None, spatial_func=None, compute_histogram=True, clim_quantiles=None, slider_maps=None, slicer_type=NDImageSlicer, colorspace='srgb', colorrange='full', name=None, graphic_kwargs=None)[source]#
NDGraphicsubclass for n-dimensional image rendering.Uses an
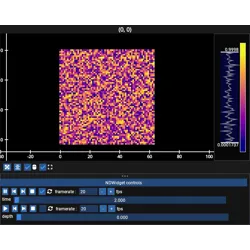
NDImageSlicerto produce the data slices and manages anImageGraphic,ImageYUVGraphicorImageVolumeGraphic, swapping between them whendisplay_dimsis reassigned at runtime. It also owns anImguiColorbarfor interactive vmin, vmax adjustment.Every dimension that is not listed in
display_dimsbecomes a slider dimension. Each slider dim must have aReferenceRangedefined in theReferenceIndexof the parentNDWidget. The widget uses this to direct a change in theReferenceIndexand update the graphics.- Parameters:
ref_index (ReferenceIndices) – The shared reference index that delivers slider updates to this graphic.
nd_subplot (NDWSubplot) – parent NDWSubplot the NDGraphic is in
data (array-like or None) – n-dimensional image data, must have 2 or more dims. Pass
Noneto create theNDImagewithout a graphic and set the data later usingdata.dims (Sequence[str]) –
Name for every dimension of
data, in order. Non-spatial dims must match keys inref_index.ex:
("time", "depth", "row", "col")—"time"and"depth"must be present inref_index.display_dims (tuple[str, str] | tuple[str, str, str]) –
The 2 or 3 spatial dims in display order, which also determines the graphic used for rendering:
(rows, cols), a 2D grayscaleImageGraphic(rows, cols, rgb_dim), a 2D RGB(A)ImageGraphic(z, rows, cols), a 3DImageVolumeGraphic
Reassigning this at runtime swaps the graphic if the number of non-RGB(A) spatial dims changes.
rgb_dim (str, optional) – Name of the RGB(A) dim, if present. It must be listed in
display_dimsand be of size 3 or 4.spatial_func (callable, optional) – See
NDSlicer.compute_histogram (bool, default
True) – Estimate a histogram of the data and display anImguiColorbaron the right edge of the subplot, which is used to interactively set vmin, vmax. Disable if random access of the data is not blazing-fast (ex: data that uses video codecs), or if a histogram is not useful for this data.clim_quantiles ((float, float), optional) –
(low, high)quantiles of the histogram, within[0, 1], used as vmin, vmax. Requirescompute_histogram=True, overrides any passed vmin, vmax ingraphic_kwargs. The limits are recomputed whenever the histogram is, so they follow the data.slicer_type (type[NDImageSlicer], default
NDImageSlicer) –NDImageSlicersubclass that manages the data and produces the data slices, ex:VideoSlicer.colorspace ("srgb" | "tex-srgb" | "physical" | "yuv420p" | "yuv444p", default "srgb") – Colorspace in which to interpret the data. The RGB colorspaces are rendered using an
ImageGraphicorImageVolumeGraphic, seeImageGraphicfor their meaning. The YUV colorspaces are rendered using anImageYUVGraphic, seeImageYUVGraphic.colorrange ("full" | "limited", default "full") – Used only for the YUV colorspaces, see
ImageYUVGraphic. Most videos use “limited”.name (str, optional) – Name for this
NDGraphic, used to retrieve it withnd_subplot[name].graphic_kwargs (dict, optional) – passed to the underlying image graphic, ex:
{"cmap": "viridis", "interpolation": "linear"}
See also
NDImageSlicerThe slicer that backs this graphic.