
Note
Go to the end to download the full example code.
ImGUI Legend#
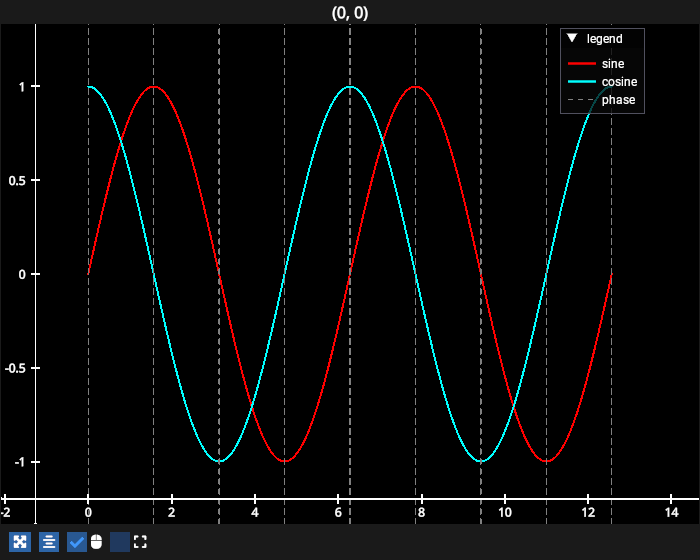
A legend for a sine, a cosine, and infinite lines marking the phase. Each graphic makes and keeps its own legend item, and the item follows the graphic, so recoloring the sine recolors its swatch.
# test_example = true

import numpy as np
import fastplotlib as fpl
from fastplotlib.ui import Legend

figure = fpl.Figure(size=(700, 560))

xs = np.linspace(0, 4 * np.pi, 400, dtype=np.float32)

sine = figure[0, 0].add_line(np.column_stack([xs, np.sin(xs)]), colors="w", name="sine")
cosine = figure[0, 0].add_line(
    np.column_stack([xs, np.cos(xs)]), colors="cyan", name="cosine"
)

# vertical lines at every half period
phase = figure[0, 0].add_inf_line(
    np.arange(0, 4.5 * np.pi, np.pi / 2, dtype=np.float32),
    axis="x",
    colors="gray",
    thickness=1,
    dash_pattern="--",
    name="phase",
)

# a graphic with one color is one entry, labelled by the graphic's name
legend = Legend(
    [
        sine.create_legend_item(),
        cosine.create_legend_item(),
        phase.create_legend_item(),
    ]
)
figure.add_imgui_window(
    legend, location="floating", rect=(0.8, 0.05, 0, 0), title="legend"
)

figure.show(maintain_aspect=False)

# the entry follows the graphic, its swatch turns yellow along with the line
sine.colors = "r"


# NOTE: fpl.loop.run() should not be used for interactive sessions
# See the "JupyterLab and IPython" section in the user guide
if __name__ == "__main__":
    print(__doc__)
    fpl.loop.run()
Total running time of the script: (0 minutes 0.132 seconds)