
Note
Go to the end to download the full example code.
Infinite Lines#
Draw infinite vertical and horizontal lines to mark positions on a plot.
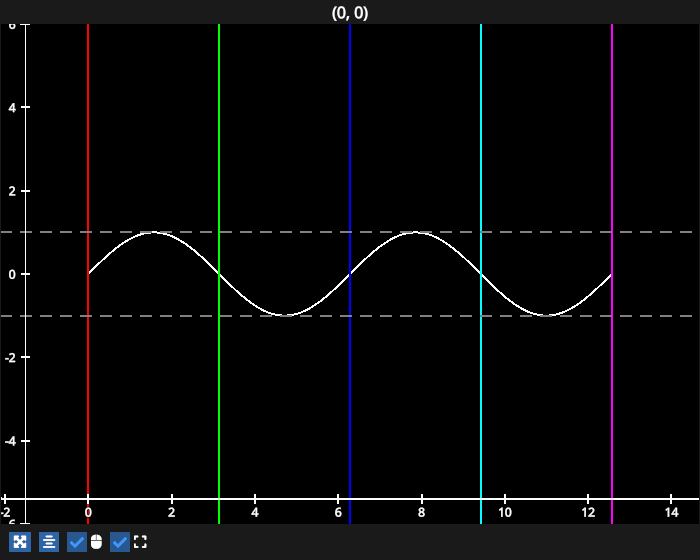
# test_example = true

import fastplotlib as fpl
import numpy as np

figure = fpl.Figure(size=(700, 560))

xs = np.linspace(0, 4 * np.pi, 100)
ys = np.sin(xs)
data = np.column_stack([xs, ys])

figure[0, 0].add_line(data, thickness=2, colors="w")

# vertical lines at the zero-crossings, one color per line by passing a list of colors
zero_crossings = np.array([0, np.pi, 2 * np.pi, 3 * np.pi, 4 * np.pi])
figure[0, 0].add_inf_line(
    zero_crossings, axis="x", colors=["r", "g", "b", "c", "m"], thickness=2
)

# dashed horizontal lines at the sine bounds, provided as a 1D array of y-values
figure[0, 0].add_inf_line(
    np.array([-1.0, 1.0]),
    axis="y",
    colors="gray",
    thickness=2,
    dash_pattern="--",
)

figure.show()


# NOTE: fpl.loop.run() should not be used for interactive sessions
# See the "JupyterLab and IPython" section in the user guide
if __name__ == "__main__":
    print(__doc__)
    fpl.loop.run()
Total running time of the script: (0 minutes 0.355 seconds)